
 In our work to help small to mid-sized business enterprises get better at managing their own inventories and improve their supply chains, we are often greeted with what seem to be fundamental questions. One of those fundamental questions is: "What is safety stock, and how do we go about figuring out how much we should carry?"
Interestingly, safety stock (s) really is not set independently. Effective safety stock quantities—if they going to be used at all—need to be set in coordination with the reorder point (r).
Reorder Point (ROP)
In a well-managed inventory system, a replenishment order is placed every time the replenishment position reaches the reorder point (r) or ROP. Therefore, in theory, the Replenishment Positions can never go negative. In essence, r becomes the BASE STOCK LEVEL.
A SKU-location (SKUL) replenishment position is calculated as:
Replenishment Position = On-hand Quantity – Backorders + (supply) Orders
If we state the expected demand over lead time as , we can expect to have r - stock on-hand when the replenishment supply order arrives.
Therefore, our minimum stock quantity becomes or (expected) lead time in days times (expected) daily demand in units. Any quantity of stock greater than r - , therefore, becomes SAFETY STOCK, and is intended to protect against stock-outs due to variability in supply or demand.
Safety Stock Calculation
SAFETY STOCK quantities, hence, may be calculated indirectly by seeking the value of r (reorder point) that will allow your system to satisfactorily cover variations in supply and demand. (That is to say, if the ROP is set properly, no portion of stock necessarily need be identified as "safety stock," per se.)
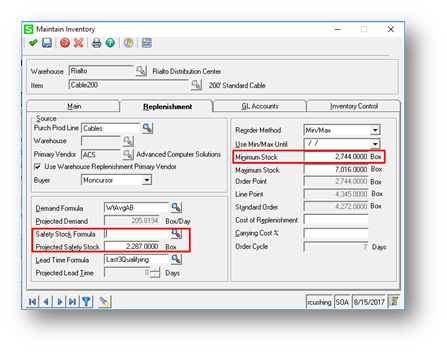
For example, in the accompanying illustration, Min/Max Reorder Methods tell the system that r (the reorder point) is 2,744 units; and that the system should order up to the Maximum Stock quantity (7,016 units). If the present replenishment position is 26 units, they MRP will tell the system to order 9,277 units (for this purchased item).
How does it calculate the 9,277-unit order? Like this:
- Maximum Stock Level – Replenishment Position = 7,016 – 26 = 6,990 units
- Safety Stock deficit = 2,287 units
- 6,990 units + 2,287 units = 9,277 units (planned order quantity)
The same effect could be achieved by simply boosting the reorder point (Minimum Stock quantity) to 5,031 units (the sum of Safety Stock and Minimum Stock), and then setting Safety Stock to zero.
Accounting for Uncertainty
Whether you do it with traditional quantities identified as "safety stock," or merely by boosting your reorder point, the intent is to provide a buffer that accounts for uncertainty, or variability, in supply and demand.
In this case (our example above), the configuration indicates that the replenishment lead time is about 21 days, and expected demand over lead time is 205.8194 (projected daily demand) * 21 = 4,322 units. The S&OP team is, therefore, allowing for about a 50 percent variability in supply and/or demand in days' coverage in safety stock (2,287 units safety stock / 4,322 units in expected demand over lead time).
Dangers with Safety Stock
Regardless of how you go about calculating it, safety stock does not come without its problems when addressed using traditional material requirements planning (MRP) methods. As Hopp and Spearman point out in their excellent work, Factory Physics:
Operations management researchers have long debated the role of safety stock and safety lead times in MRP systems. Orlicky felt these had no place in the system except, possibly, for end items. Lower-level items, he believed, were more than adequately covered by the workings of the system. Since Orlicky's time, many researchers have disagreed. Because MRP is deterministic, the logic goes, something should be done to account for uncertainty and randomness. [p. 133]
[A]lthough safety stock and safety lead times can be useful in an MRP system, we must be cognizant of the fact that both procedures lie to the system. Safety stock requires the intentional production of quantities for which there is no customer need, while safety lead times set due dates earlier than are really required. Both situations will make available-to-promise calculations (used to quote deliveries to customers…) less accurate. Excess safety stocks and long safety lead times will result in customers being turned away because of perceived schedule infeasibility even though the schedule is actually feasible. In addition, there is always the risk that once safety stock and/or lead times are discovered by the users, an informal system of "real" quantities and due dates will appear. Such behavior can lead to a subversion of the formal system and can degrade its performance. [pp. 134f – emphases added]
Hopp and Spearman also point out the dangers to cash-flow and return-on-investment of failing to strategically analyze how your stock is positioned in your supply chain:
[C]onsider a computer manufacturer that sells systems with three different choices of processor, hard drive, CD-ROM, removable media storage device, RAM configurations, and keyboard. This makes a total of 36 = 729 different computer configurations. To make the example simple, we suppose that all components cost $150, so that the cost of the finished good for any computer configuration is 6 x $150 = $900. Furthermore, we assume the demand for each configuration is Poisson with an average of 100 units per year and that replenishment lead times for any configuration is 3 months.
First, suppose that the manufacturer stocks finished goods inventory of all configurations and sets the stock levels according to a base stock model. Using [standard techniques], we can show that to maintain a customer service level (fill rate) of 99 percent requires a base stock level of 38 units and results in an average inventory level of $11,712.425 for each configuration. Therefore, the total investment in inventory is 729 x $11,712.425 = $8,538,358. [p. 300]
It is easy to clog your supply chain with too much stock, believing that more inventory will protect FLOW better. More inventory is just more inventory if your stock is not strategically situated in your supply chain and providing real and effective return-on-investment. Read Optimizing Your Inventory and Supply Chain.
Becoming demand driven is the best solution, and we can help you get there, Get in touch.
Thanks to: Hopp, Wallace J., and Mark L. Spearman. Factory Physics. Long Grove, IL: Waveland Press, 2011.