[This is a continuation that will make very little sense to you if you don’t go back to read The Hidden Danger of Cost Allocations Part 1. ]
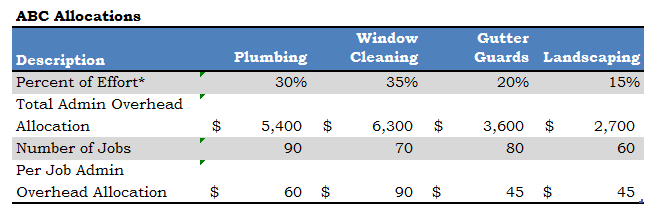
Well, the partners were disappointed with these results. So, they decide to try Activity-Based Costing (or ABC) allocations. The administrative overhead is allocated based on their analysis of the amount of activity that the partners must undertake with each job type.
The ABC allocation of non-administrative overhead was done based on production-hours ($9,000 divided by 1,000 hours = $9.00 per production-hour).
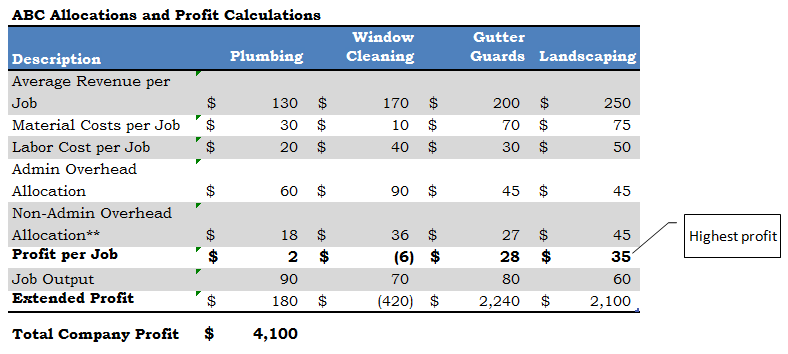
The results of the partners’ new calculations (based on the historical product mix) are shown below where you will note that company profit remains the same ($4,100 per month).
However, new priorities emerge: now the most profitable jobs appear to be landscaping (at $35 per job) and gutter guards (at $28 per job).
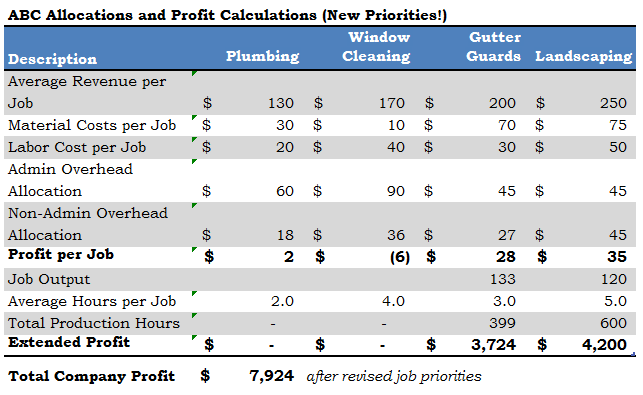
Based on these data, the partners rearrange priorities to allocate resources (i.e., the 1,000 hours or production time available) to capture the available markets for these job-types first. The results of this change in priorities may be seen in the following table:
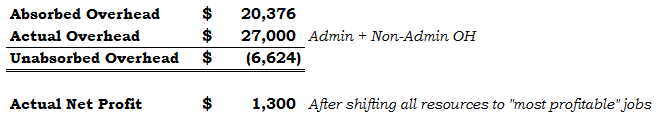
Like the previous example, at first things look good: “calculated profits” boost to $7,924, but after subtracting overhead not absorbed (by abandoned job-types), the results are disappointing. Only $1,300 per month in net profits.
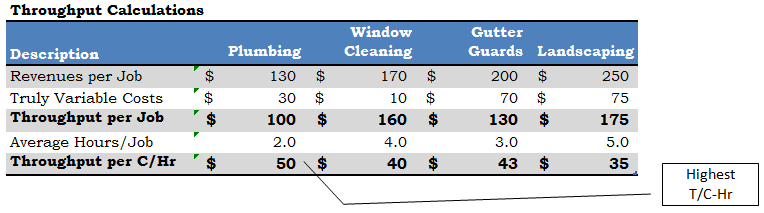
Throughput accounting eliminates all allocations except those that are truly variable with the changes in revenue. Typically, those costs are things like raw materials, commissions (maybe), outside processing costs, piece-rate labor—but not much else.
When you look at these Throughput Calculations, you will see two critical factors:
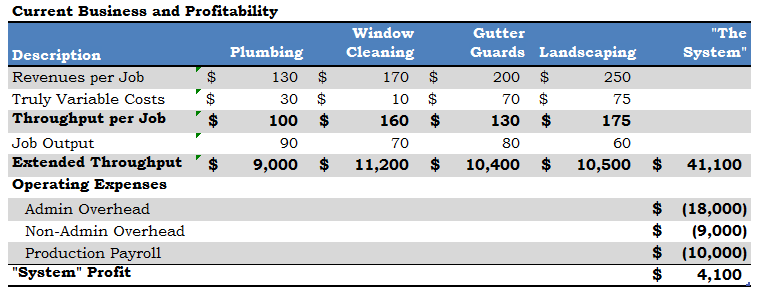
So, looking at the Current Business and Profitability, you will see that another column has been added that represents the company as a whole or “the system.” Throughput is totaled across the enterprise into this column and then operating expenses are deducted from Throughput.
Because in most organizations, so-called direct labor is not a TVC, many times the payroll expense for labor will be the same whether the firm produces 10,000, 12,000, or 8,000 widgets in a month. Not to mention the fact that the payroll for “direct labor” (falsely so-called) sometimes includes payments for PTO, training or other non-productive time.
Note, again, that using Throughput Accounting, we still get the same net profit calculations ($4,100 per month).
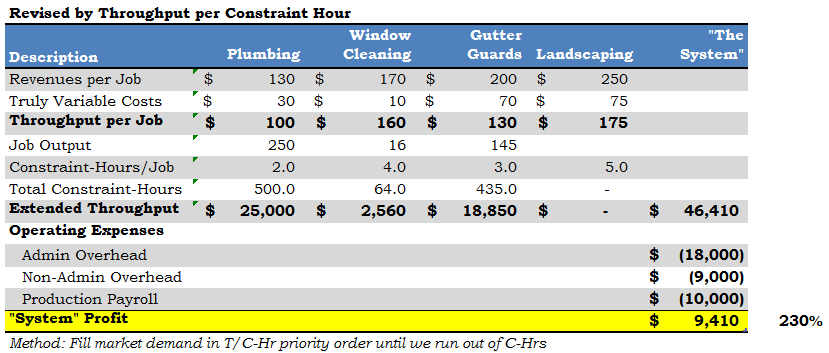
Now, with this new information in-hand, the partners decide to prioritize sales and production to capture the market in order by T/C-Hr (Throughput per Constraint-Hour) until they run out of constraint-hours (i.e., the 1,000 hours available to them each month). The results of these new priorities are shown in the table below marked as Revised by Throughput per Constraint-Hour.
Wow! Profits are boosted 230 percent—to $9,410 per month or $112,920 annually—after fully covering all of “the system’s” overhead. In this case, they sought out and captured the 250 plumbing jobs available to them in the market as a top priority. Their second priority was to capture the 145 gutter guard jobs available to them. They had a few of the 1,000 hours left, so they were able to also do 16 window cleaning jobs.
Hopefully, this helps you see two things:
Let me know if this is valuable to you. Thanks.