Three warnings for my clients who buy manufacturing software :
- Manufacturing software is capable of capturing, storing and reporting on reams of data.
- When you are configuring your manufacturing software, you are going to provide data—much of which will be coming from averages, assumptions and outright guesses.
- When you are using the software, if you are not careful, you will find yourself taking “as fact” the data produced by the system and being mislead in your decision-making.
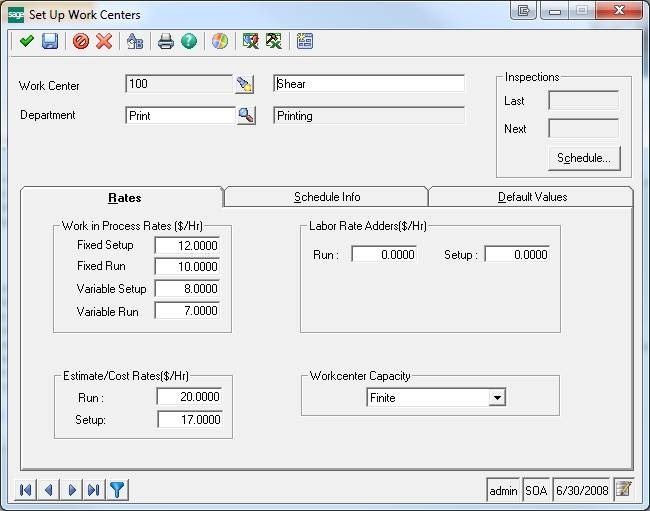
Because ERP systems allow the users to create allocations of overhead based on manufacturing “drivers.” Using Sage 500 ERP’s case as an example (as shown in the screen image below), the chosen driver is “labor hours”—for run time and set-up time.
In the Sage 500 ERP Set Up Work Center screen there are places for “Fixed Setup” costs and “Fixed Run” costs. The values placed here are used to absorb “Fixed” overhead costs at the rate supplied based on each hour of “Setup” or “Run” time calculated for production utilization of the Work Center.
The problem is that these “absorption rates” must be calculated based on historical (or prognosticated based on expected future) utilization rates of each Work Center. These calculations must make assumptions about product mix, work center utilization rates and operating expense levels. As soon as any of the these factors change
The data supplied by the calculations will be wrong.
And, since either the product mix or the total of operating expenses will certainly be different than the numbers used in the calculations, the data resulting from the calculations will (virtually) always be wrong.
We are going to look at two different allocation methods and the decisions that might be derived from such calculations.
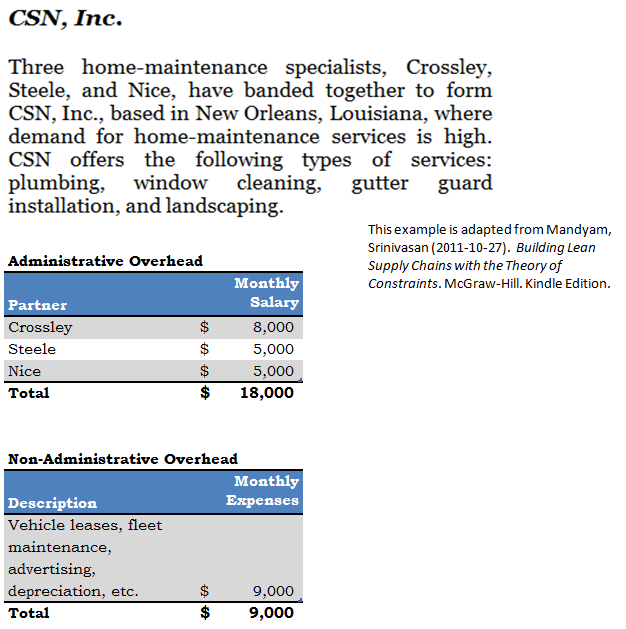
In order to make the allocations easy to follow, you will see that the company is a service company and that the firm has three partners (administrative overhead) and some relatively fixed overhead in the form of vehicle leases, maintenance and so forth.
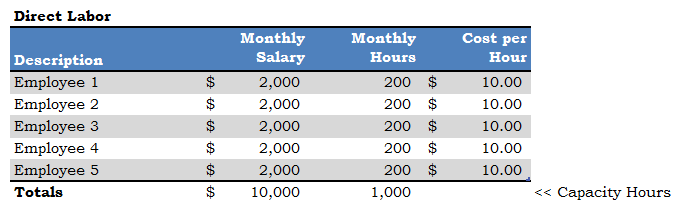
The direct labor (production labor) comes from five employees who—to make it simple—all work exactly 200 hours per month and all make exactly the same rate—$10 per hour. This also gives “production” a known capacity—1,000 hours per month.
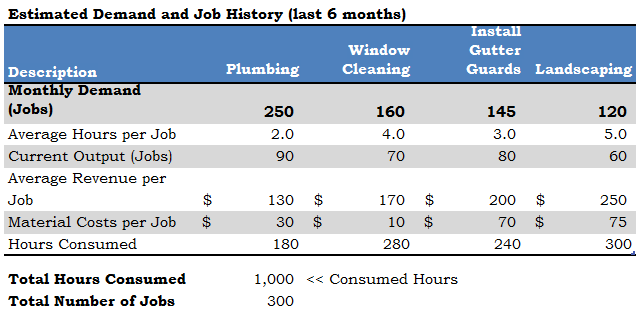
The partners have kept good track of their history over the last six months and have also done enough market research to have a good handle on the size of the market they are serving. They know, therefore, how many of each kind of job they have done each month (on average), as well as the market potential for the kinds of jobs they do.
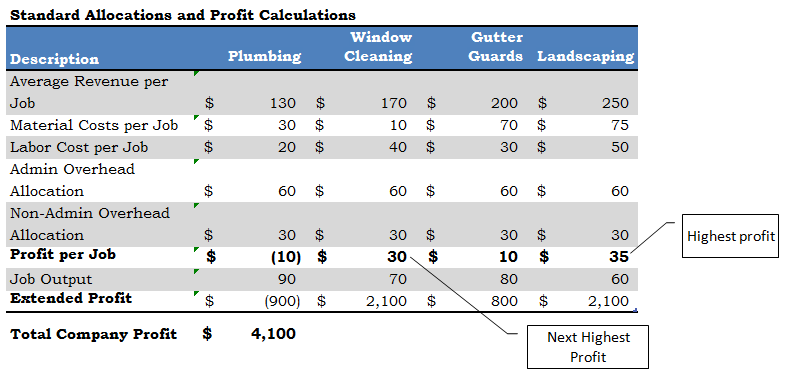
In an attempt to leverage what they have learned by capturing data about past performance and, of course, to improve profitability, the partners do an analysis that includes a standard allocation of overhead to each job.
From this analysis, they discover that their most profitable jobs are landscaping jobs ($35 per job), followed closely by window cleaning jobs ($30 per job). So, they decide to satisfy the market demand in that order, using the resources they have (1,000 hours of production time).
Before we move on, note that with their present product mix, the company is producing a profit of $4,100 per month ($49,200 per year).
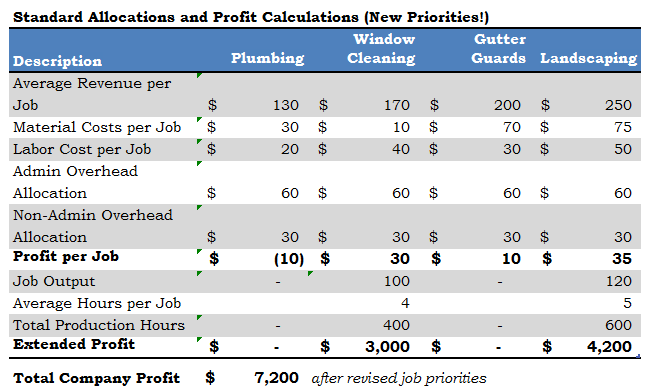
The results of this action are shown here:
Upon first glance, it appears that this has been a great move. Based on the calculations in the table, profit has moved from $4,100 per month to $7,200 per month!
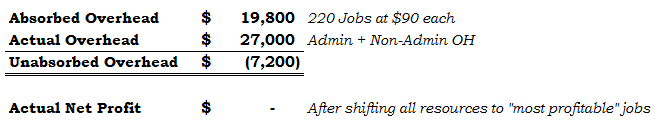
Again, the problem is that since NO plumbing or gutter guard jobs were done, some of the overhead (allocated at $90 per job) was not absorbed in the calculations. The total overhead is $18,000 plus $9,000, or $27,000. But the 220 jobs only absorbed 220 times $90, or $19,800 in overhead. That leaves $7,200 in overhead NOT absorbed. Take that $7,200 away from the calculated profit of $7,200 and the company is actually worse off (zero profit) after having reallocated its resources to what appeared to be the “most profitable jobs.”