

 Adaptive Insights recently released the first update for 2018. The features in the Adaptive Suite 2018.1 release enable teams to work faster and smarter with enhanced visual analytics, expanded consolidation features and integration capabilities that enrich the Adaptive Suite data. In this article, we'll explore some of the new features.
Key New Features
- Filter on Modeled Sheets with Excel Interface for Planning
- Reset to Default Views in Sheets
- Open Multiple OfficeConnect Workbooks
- Initial Balance Entry in Multiple Currencies
- Submit Workflow for Actuals
- Automated Dimension Metadata Loading
- API Enhancements for Dimension Updates and Currency Exports
- Enhanced exportActiveCurriencies API
- Sort and Limit Data in Charts
- Global Dashboard Time
- Time Selection Enhancements
- Conditional Formatting on Charts
- Ad-hoc Calculations on Charts
- Enhancements to Scorecard Defaults
- User Defined Currencies
Planning and Reporting
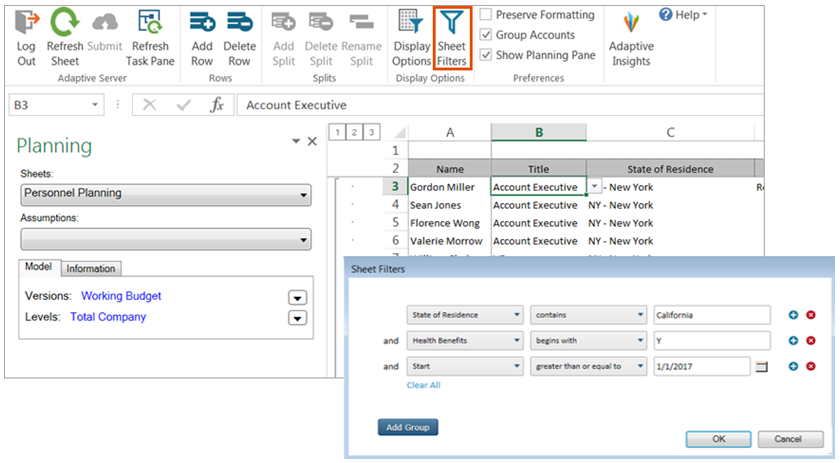
A new Filter button on the Excel Planning ribbon lets you filter modeled sheets.
- Find relevant data without having to search and scroll.
- Easily manage large modeled sheets with lots of rows.
Other key Planning and Reporting features added in Adaptive Insights 2018.1 include:
Reset to Default Views in Sheets - after you've changed Display Options to modify your view of sheets, you can return to your original view with one click of the new Reset to Default View button
Open Multiple OfficeConnect Workbooks - you won't be forced to save and close a workbook before opening another.
Consolidation
Initial Balance Entry in Multiple Currencies
Create currency-tagged splits in Standard Sheets to enter multiple currencies in the initial balance column for a single account. This allows you to specify an account's initial balance in each currency at its true valuation without having to calculate an inferred exchange rate.
For example, your instance has three levels that track Retained Earnings and each level has a different currency. You enter the initial amount for each currency into a split in the initial balance column. The values thereafter calculate per level and convert automatically to the level's currency.
To set this up, add currency as a dimension when building a standard sheet. Then, when entering data, split the account and choose currency from the dropdown. Enter different currency values associated with each currency in each split.
Submit Workflow for Actuals
Use Workflow to submit, approve, and reset workflow by levels and sheets for your actuals version. After loading data, entering exchange rates, and posting all journal entries in your actuals version, you can submit actuals levels for review and approval.
Before you get started, enable Workflow for your actuals version.
Discovery
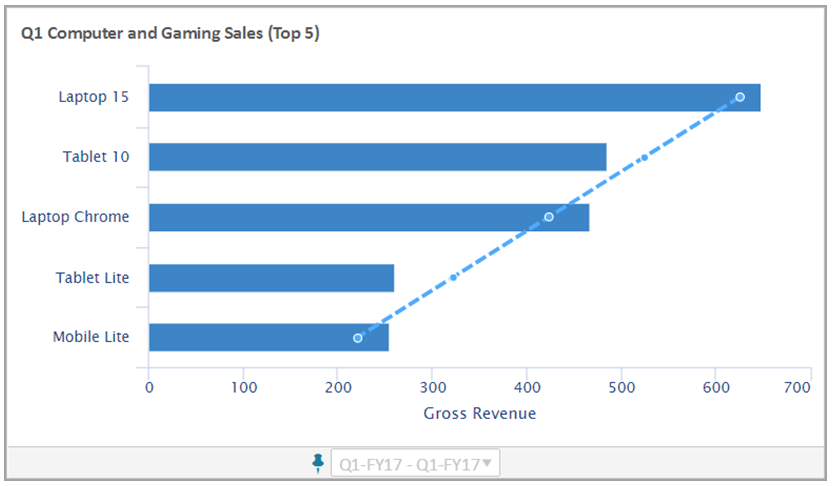
Sort and Limit Data in Charts
You can sort data in ascending and descending order when viewing a chart in Grid or Presentation mode and when editing a chart.You can also filter the sorted data to show the Top N or Bottom N of the data set.
The following chart is sorted by revenue and shows the top five best sellers – from highest to lowest:
Global Dashboard Time
Global time influences time settings for each chart in dashboards on a perspective. You can set a different time for each perspective from the Perspective Context. Charts with unpinned time settings move their time forward or backward as time on the perspective moves forward or backward.
You can override time by pinning time on charts to a fixed time setting. Pinned time on charts ignores time on the perspective and will not change as time on the perspective changes.
Changed how to specify the offset on pinned time
When time on a chart is pinned to move with time set on the perspective, you must define the relative movement on the chart time:
- Set relative time as Current, Forwards, or Backwards
- Specify a positive offset
In prior releases, directionality was indicated by a positive or negative value, such as -3 to indicate an offset 3 months backward in time.
Changed how to choose a range of time
We’ve removed From and To labels from the Time Settings interface and streamlined how you choose start and end dates for a range of time.
Conditional Formatting on Charts
Highlight data that stands out from norms. You can specify how to display and format data that falls within specific ranges or meet certain conditions. For example, you can format values in red when revenue falls above or below expectations.
Ad-hoc Calculations on Charts
Calculate this! You can now create ad-hoc calculations and apply them to any visualization that you create in Discovery. We provide the user interface for creating well-formed calculations – similar to the Formula Editor in Planning.
Have a Question Or Need Help?
![]()
Click below to get in touch if you have a question about Adaptive Insights 2018.1 or need help upgrading.