

The latest version of Sage Enterprise Intelligence (SEI), 9.2.6791 UDM template has prebuilt reporting and dashboards for Finance, Sales, CRM and Inventory. Today we will focus on the Universal Finance Data Model.
Universal Finance Data Model
The Finance UDM can be used with your ERP system or can be used to consolidate data from multiple ERP systems. Examples of consolidation might be for Sage 300, where Sage 300 has companies stored in their own database, you can combine the multiple companies in the UDM OLAP cube and then report on consolidated financials or individual using one combined database.
Maybe you are currently running Sage X3 and you are acquiring another entity. By connecting to the other entities data, you could combine that in the UDM OLAP cube along with your X3 data and run consolidated financials until the new entity is up and processing in Sage X3.
Another example might be that you are currently using Sage 500 but are in the process of migrating to Sage X3. By setting up the appropriate data source connections, chart of account mappings and analytical dimensions, you can then use the consolidated data to report on combined financial information where last year might be based on Sage 500 data and this year data might be pulled from Sage X3. Sage X3 utilizes a chart of accounts for the account code and analytical dimensions for things like departments, divisions, etc. and Sage 500 might have these same reporting values as part of its GL segmentation. » VISIT SAGE X3 MIGRATION CENTER
Once you have the connections in place and have followed the template instructions for building and loading the cubes, you can setup your dimensions and map your chart of accounts to the defined categories.
Account Mapping
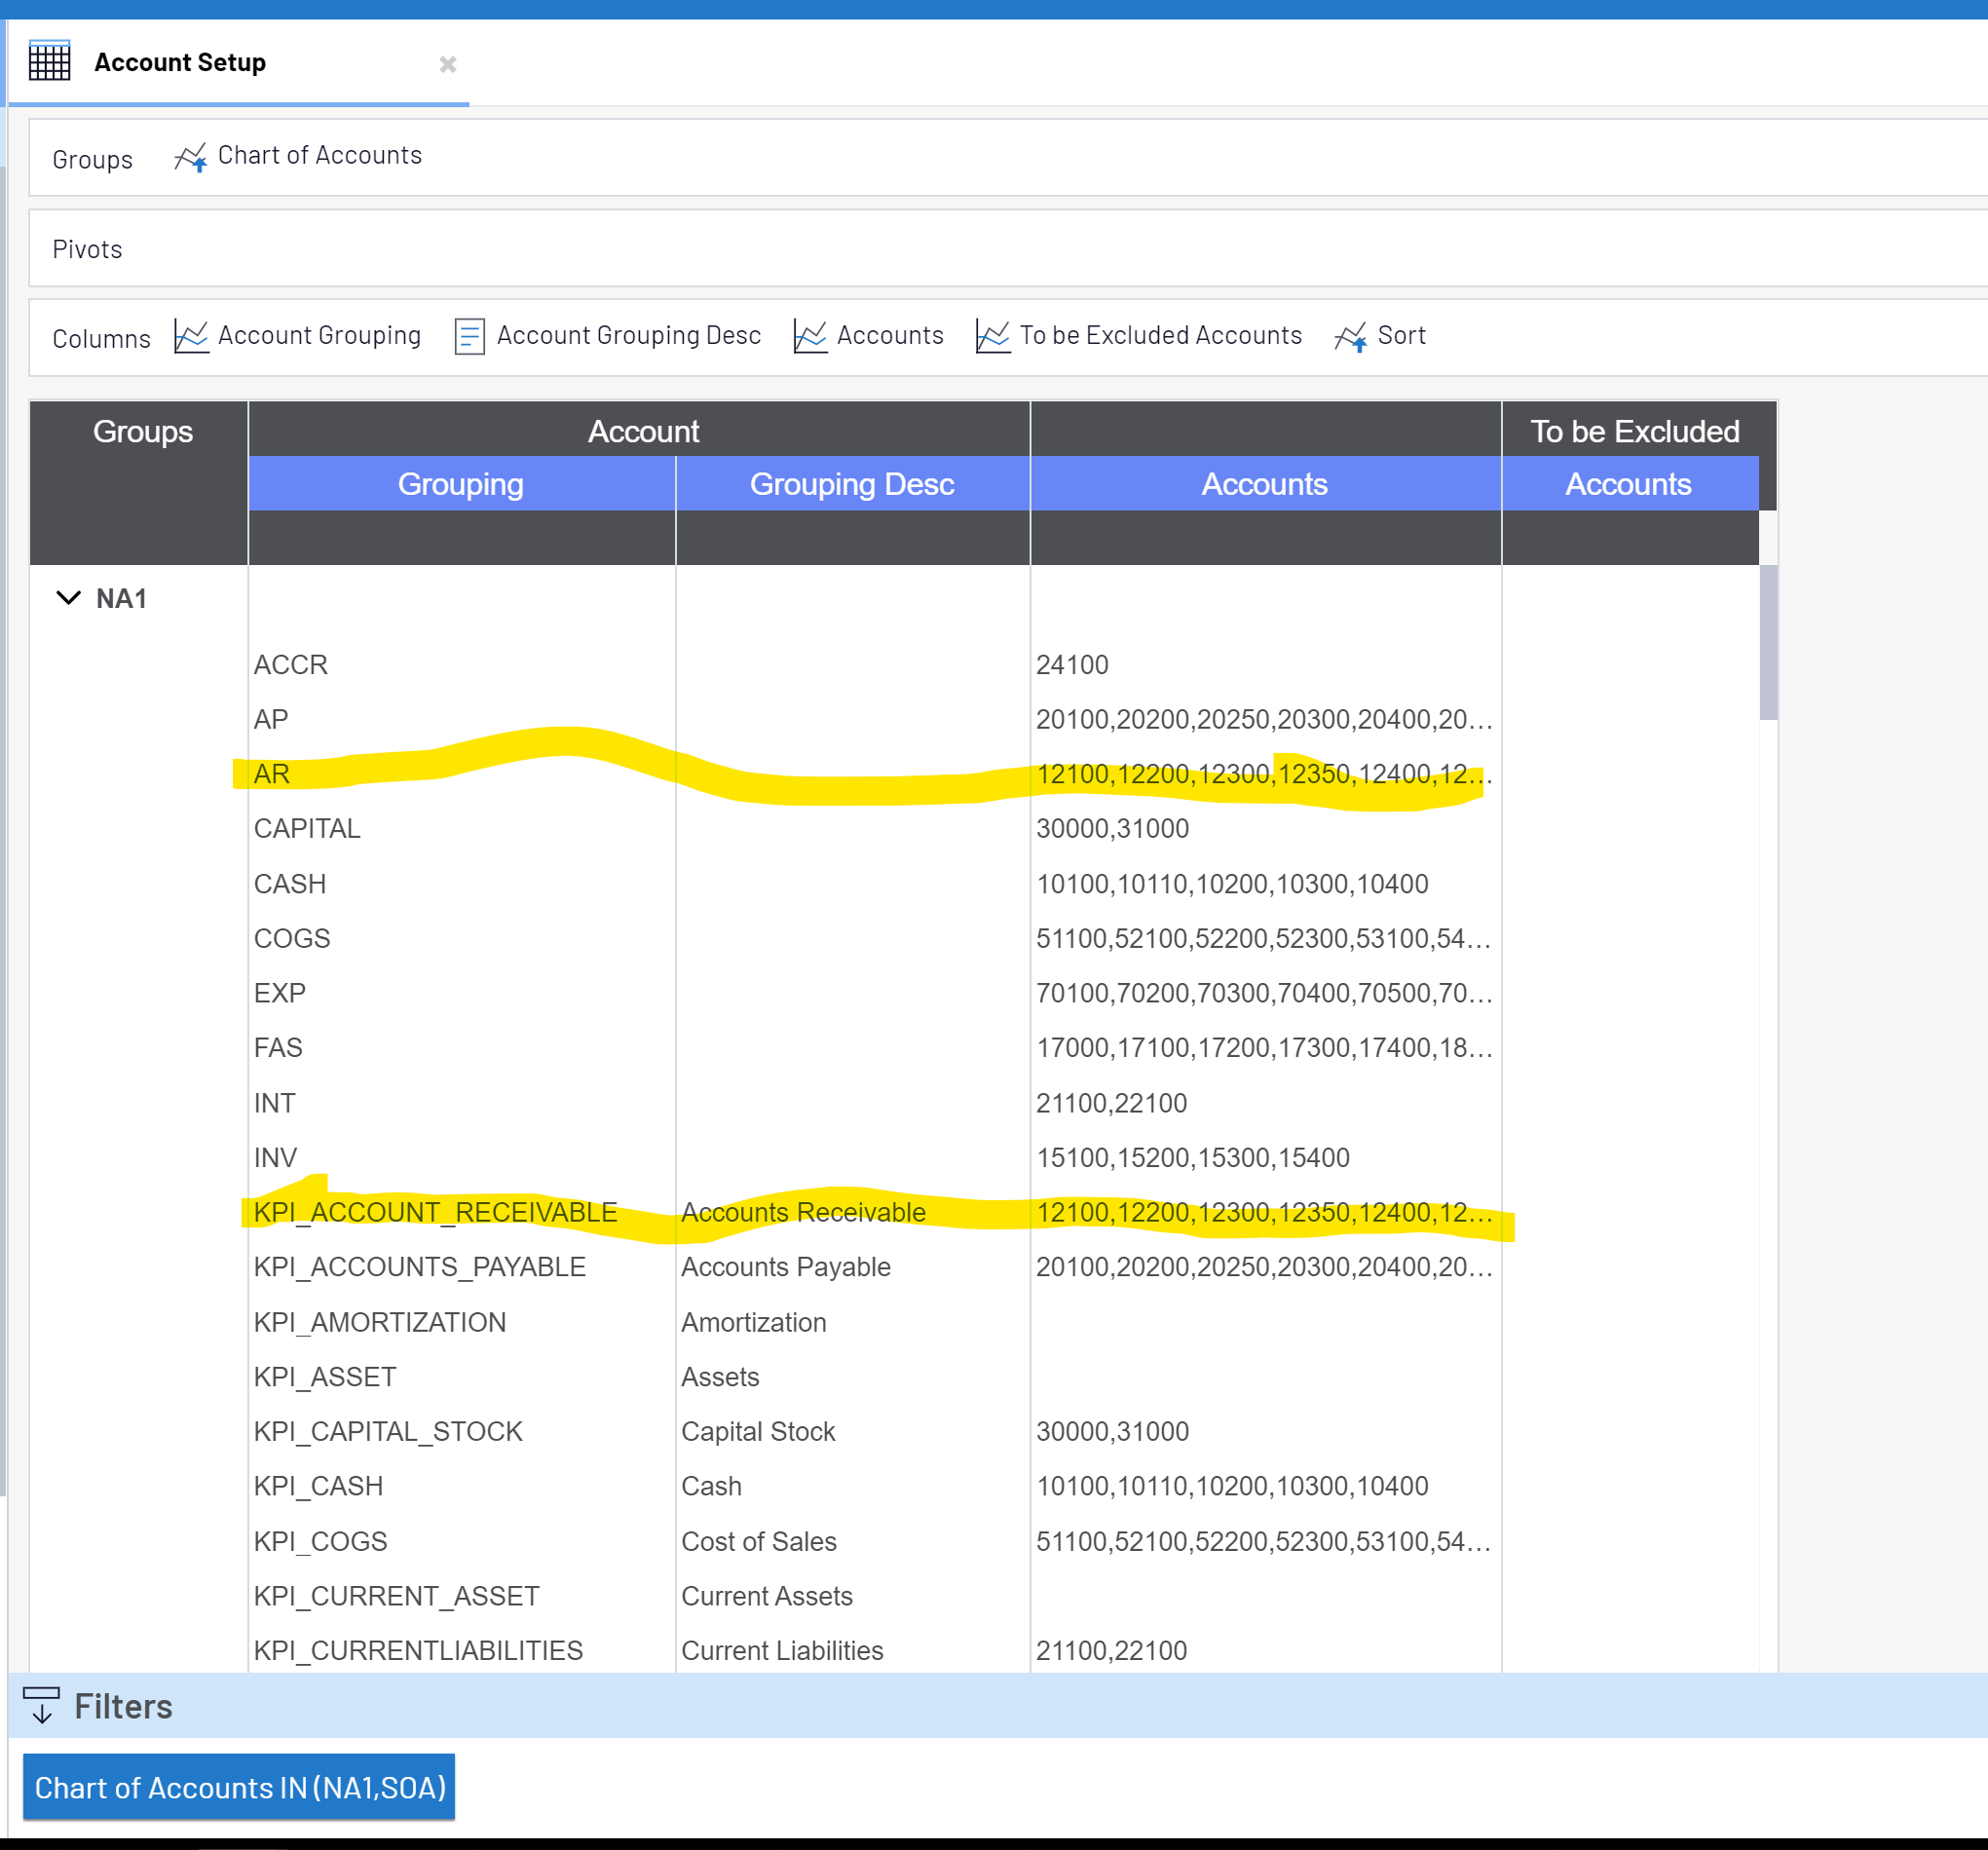
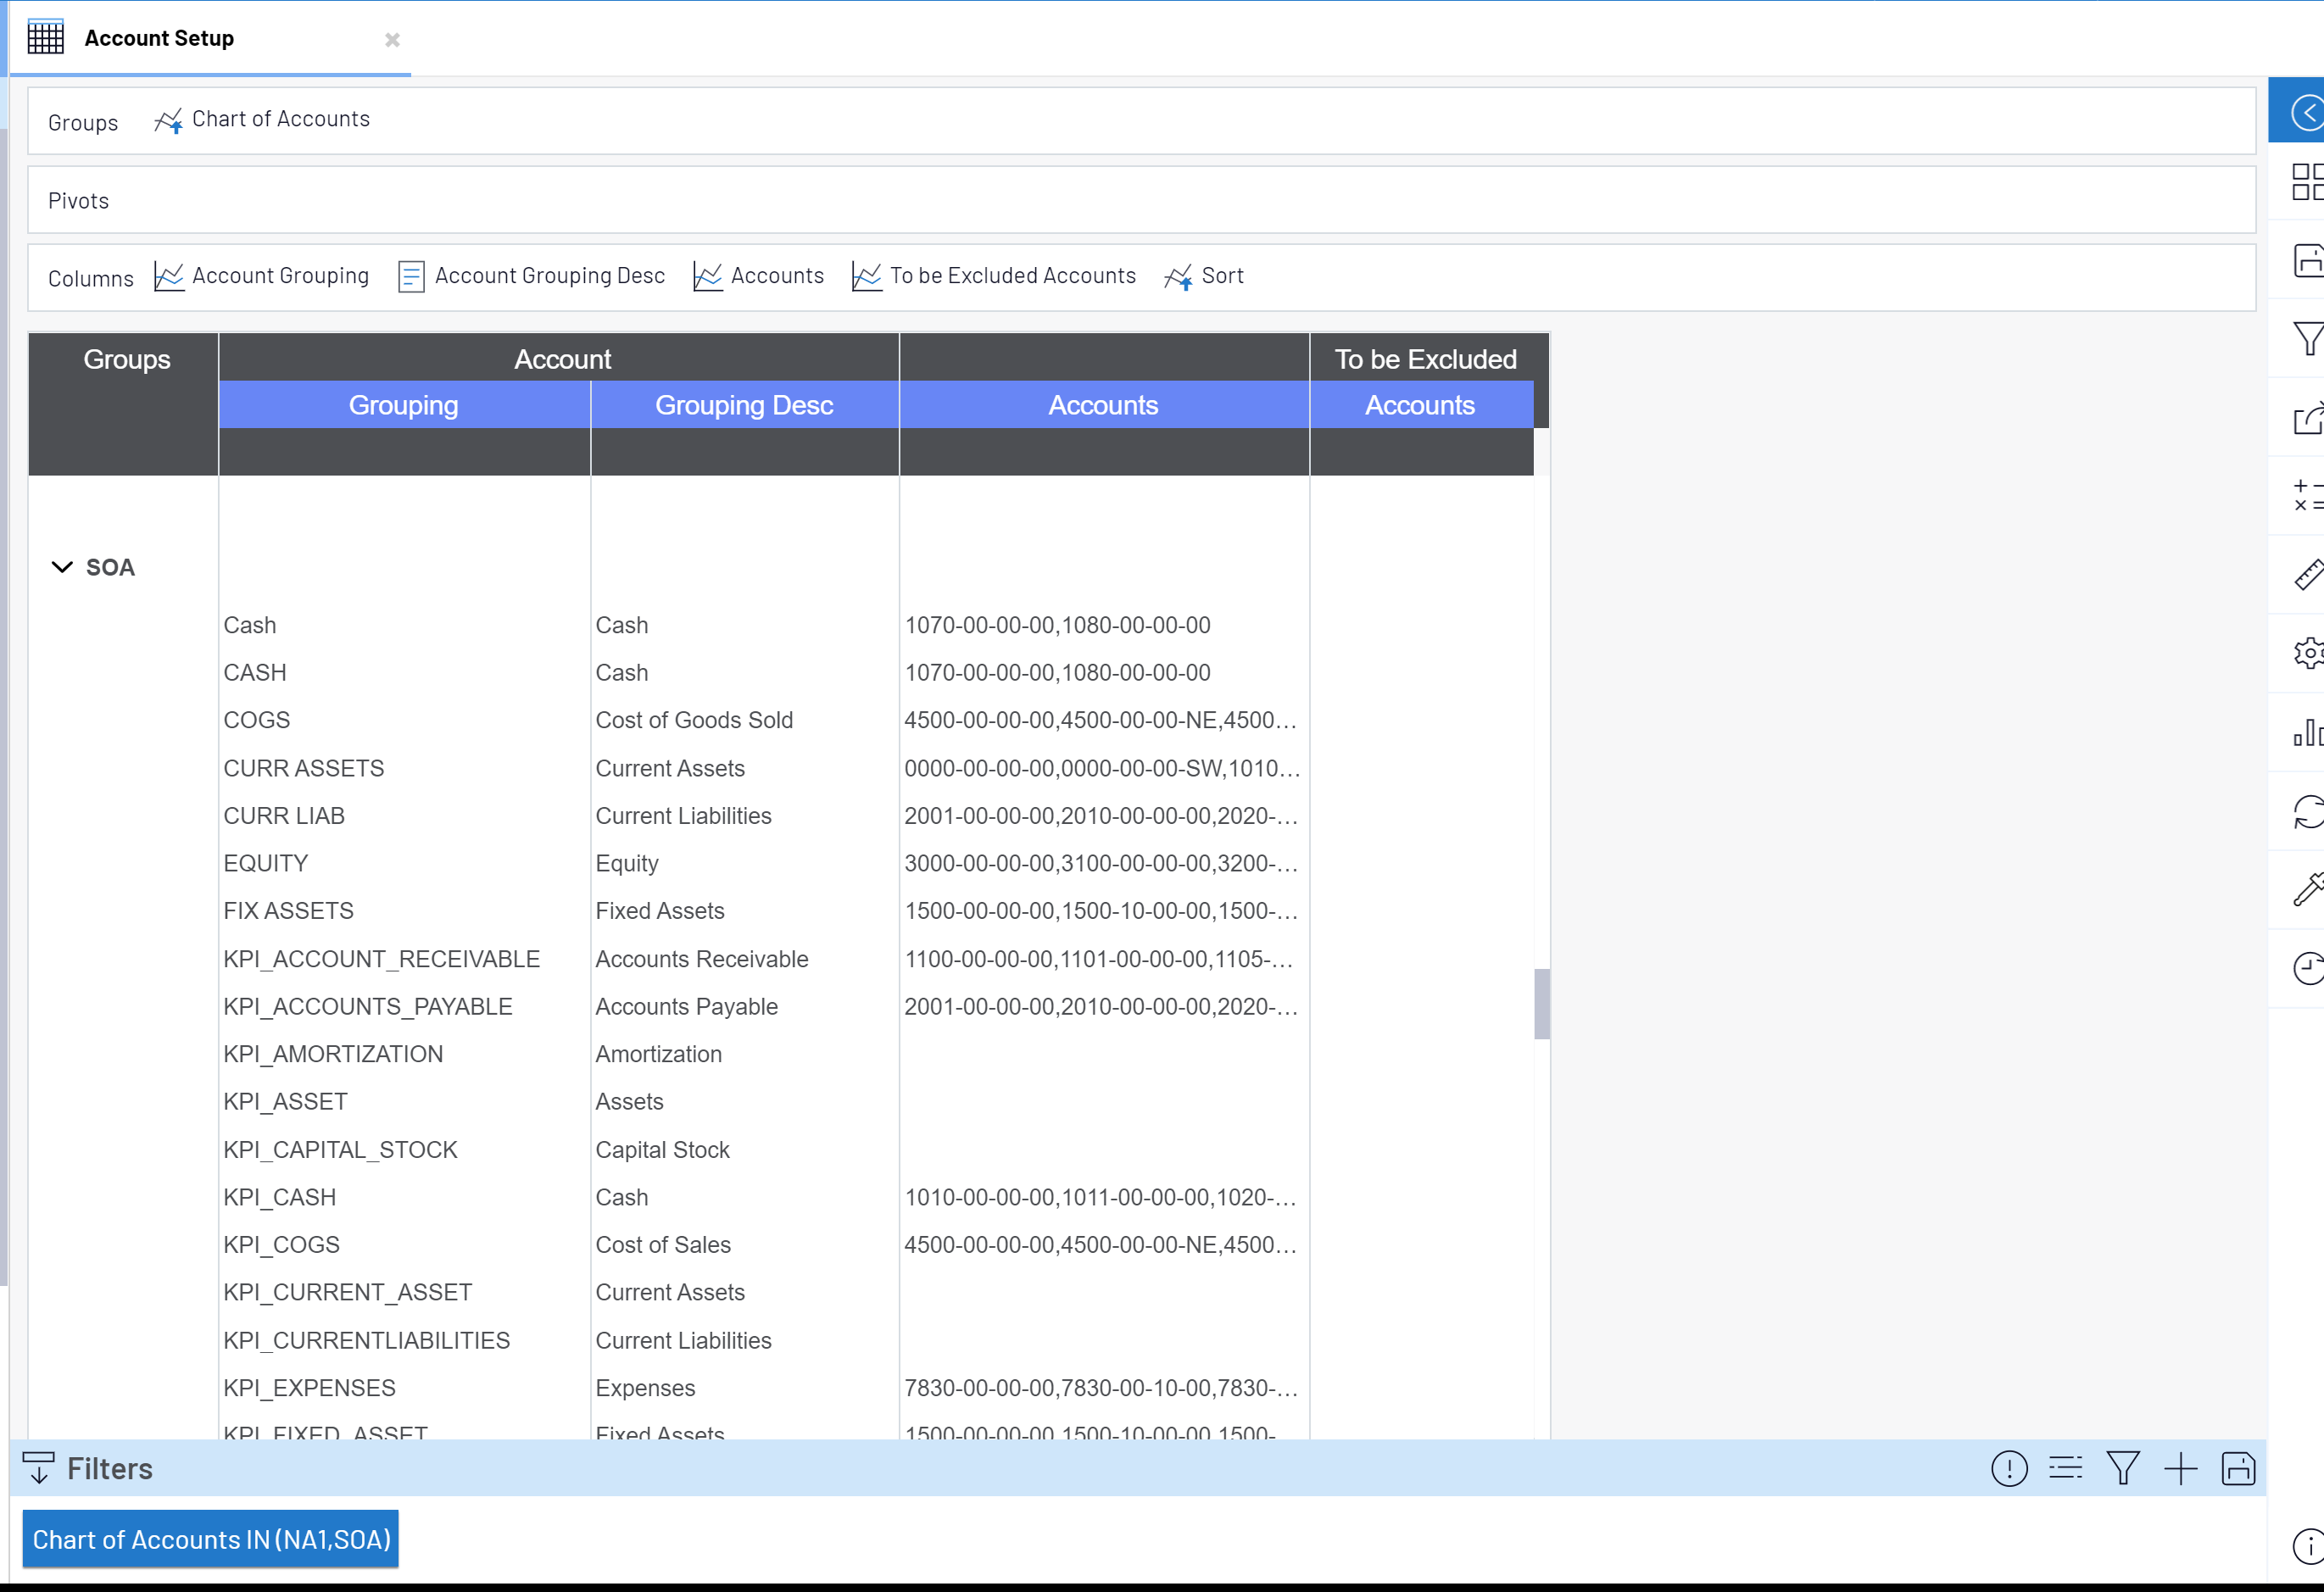
The first step in Account Mapping is to generate the default Account Groupings. Enter or select the first chart of accounts and then click the Generate button associated with your database platform (either SQL Server or Oracle). The second step is to import the account groupings from your ERP system. You can repeat the first two steps for each chart of accounts you want to create mappings for. In my examples, I am using the NA1 chart of accounts from Sage X3 and the SOA chart of accounts from Sage 500.
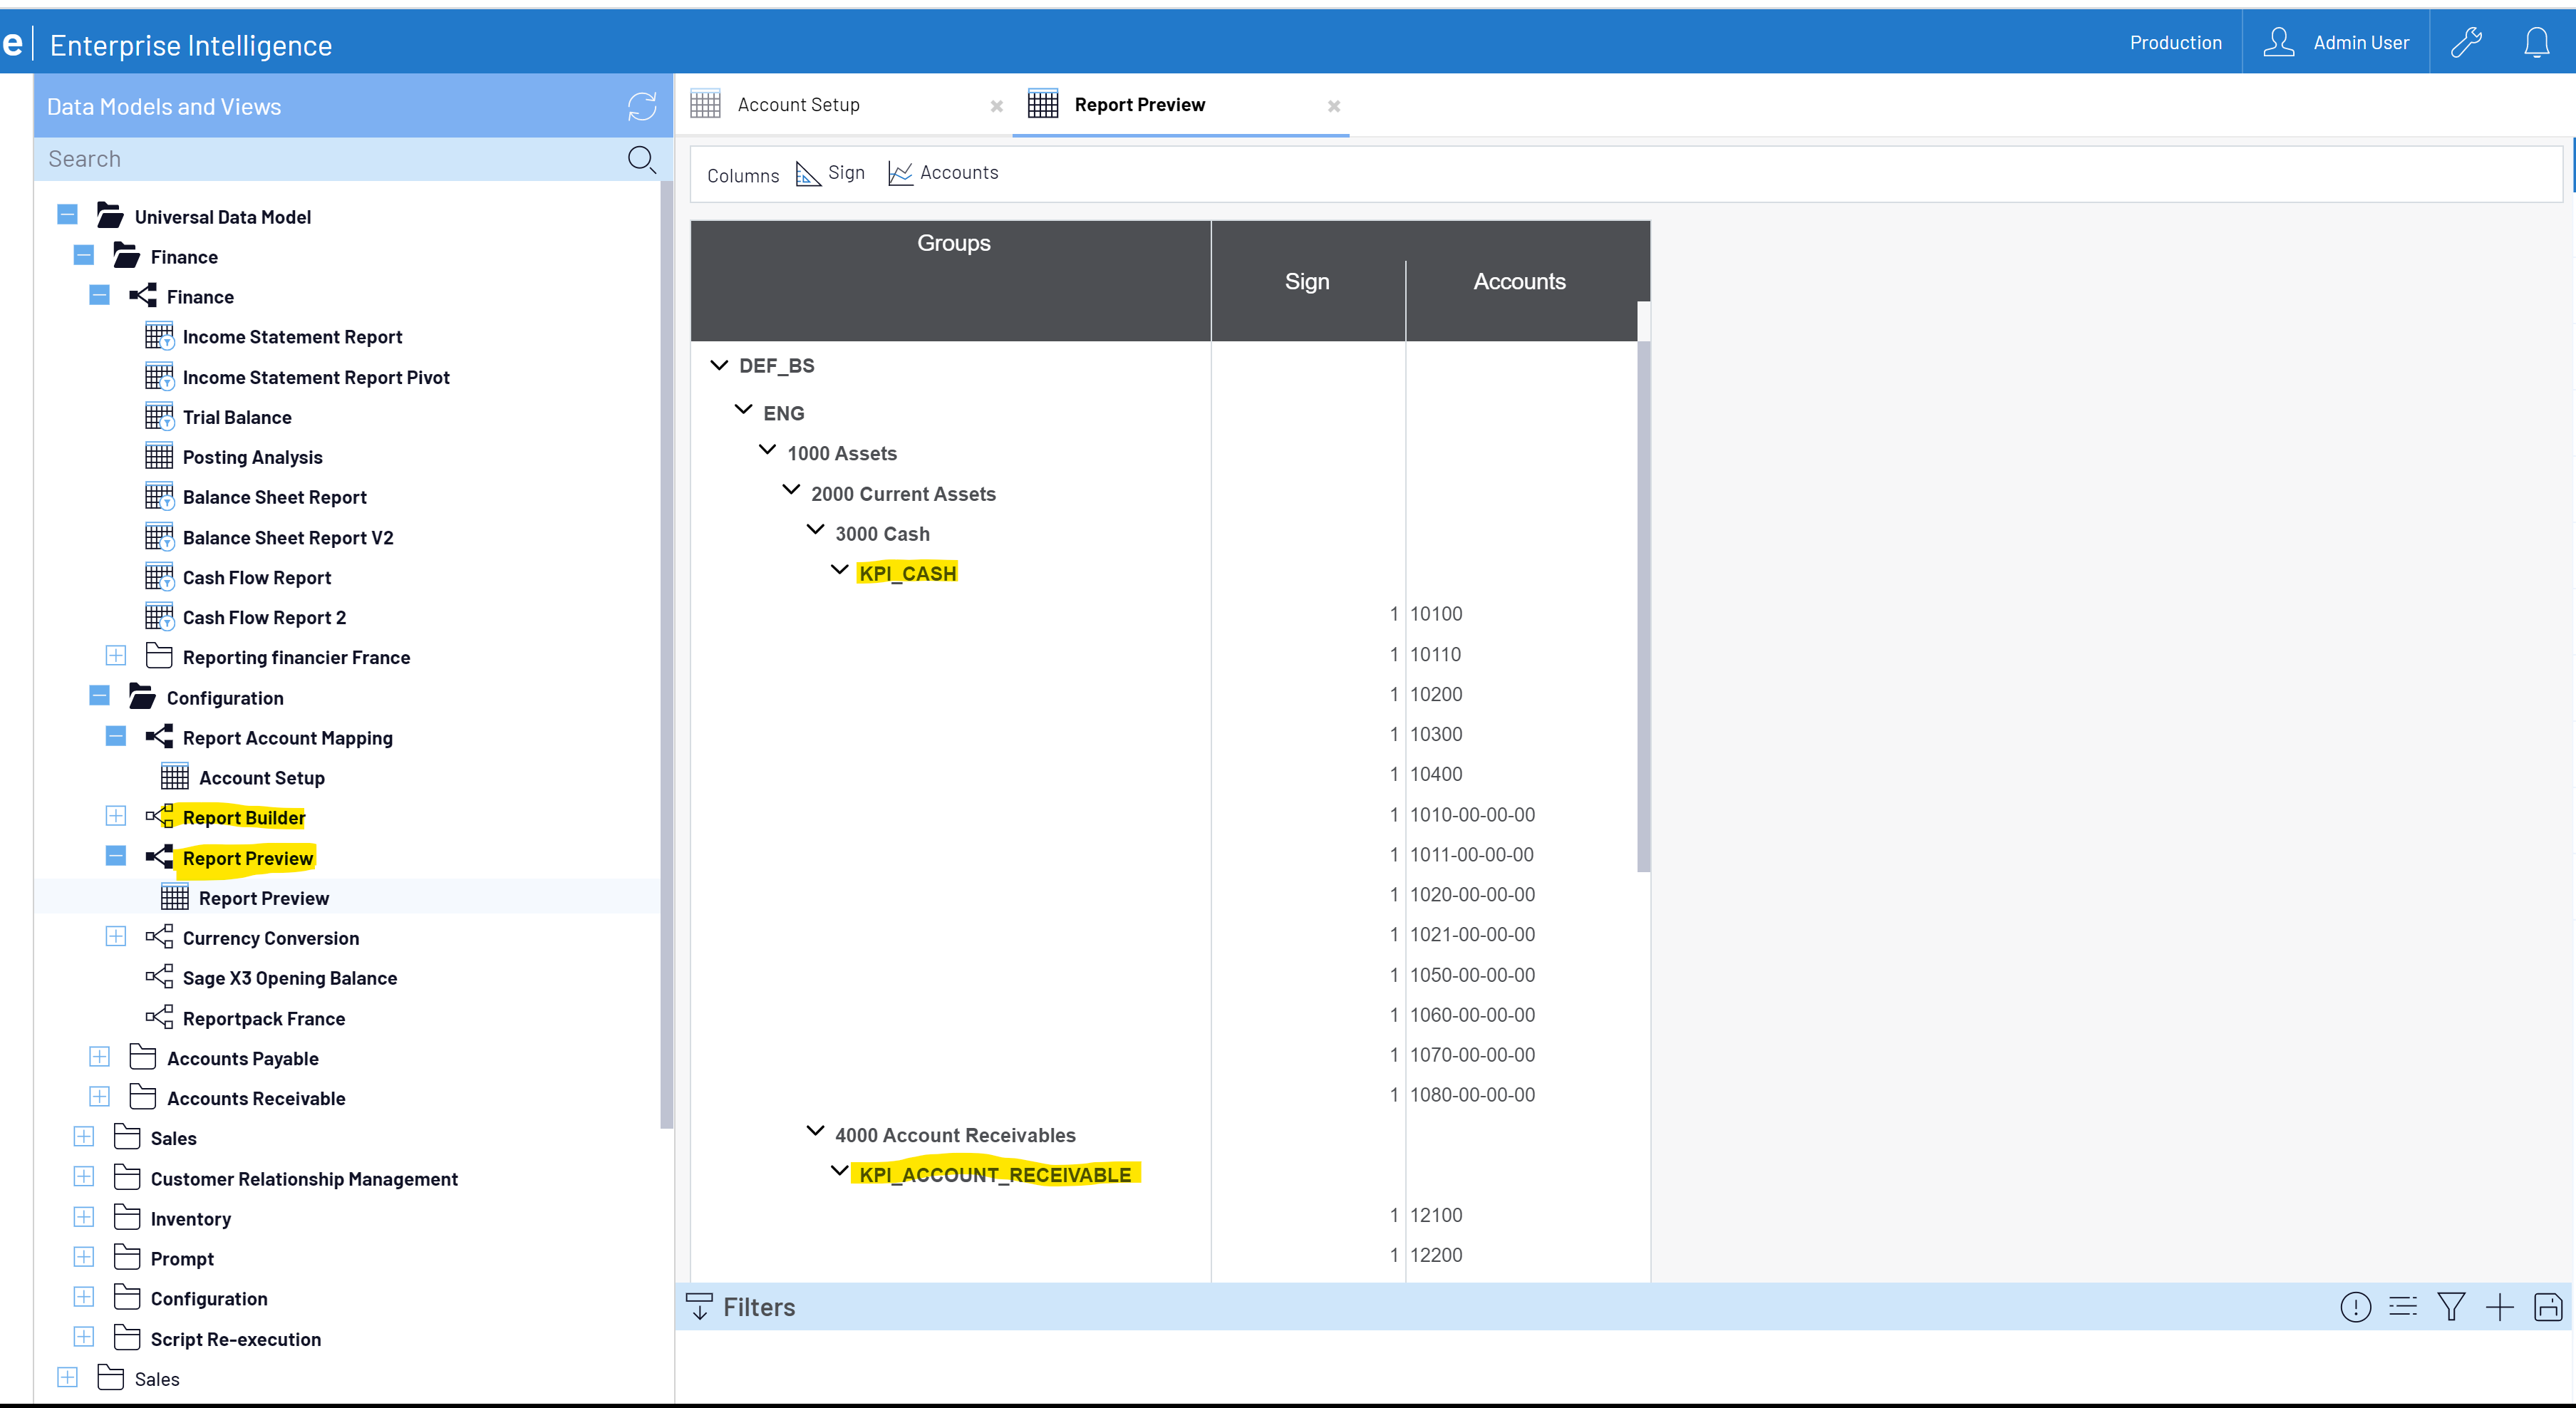
Now you are ready to map your accounts to the grouping categories. Open the Account Setup worksheet view.
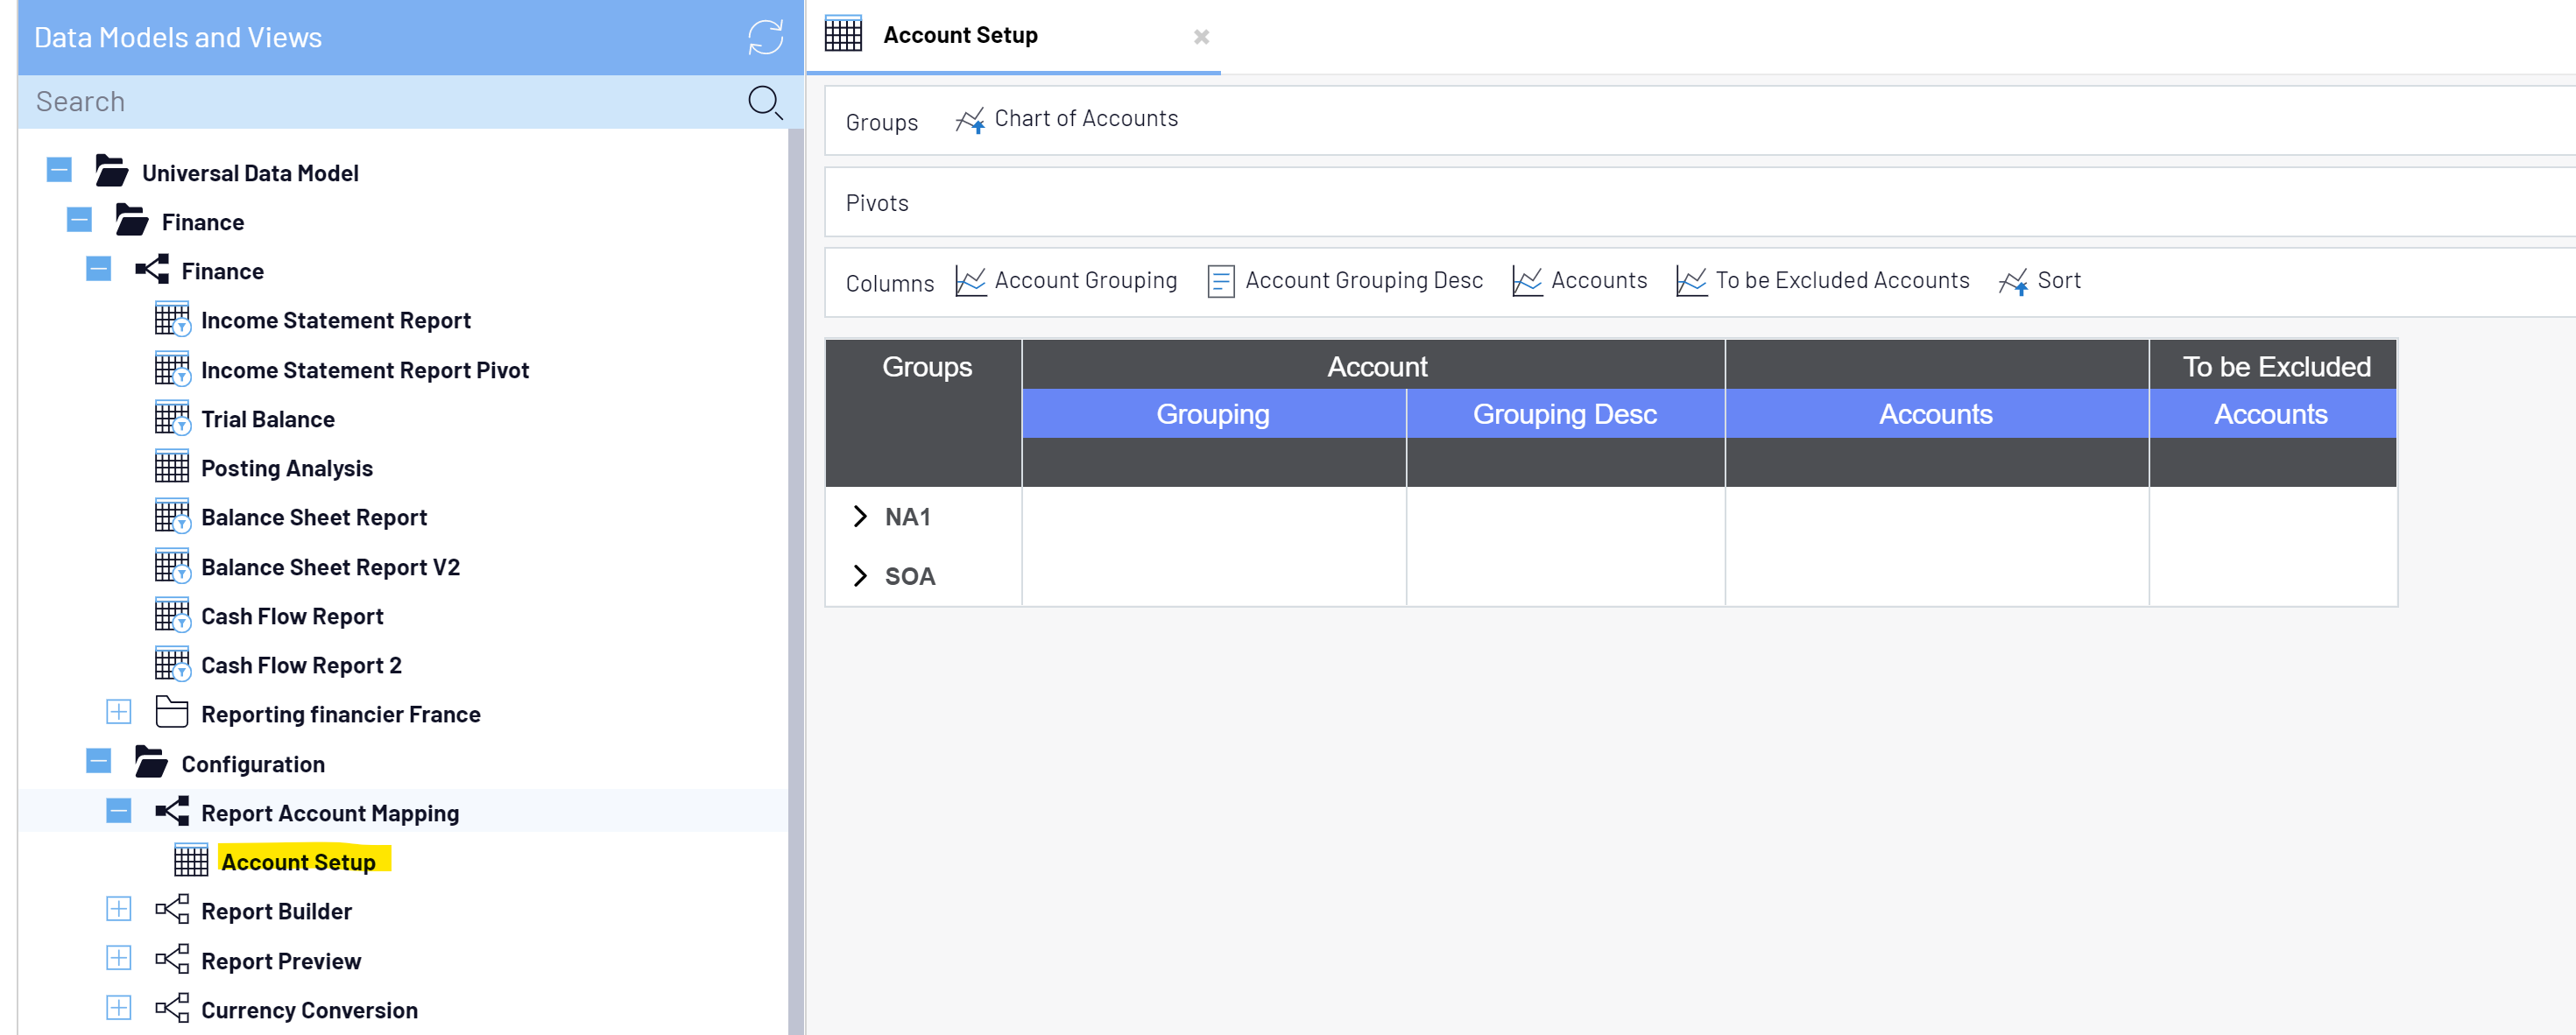
Under each chart of account code, your ERP groupings and associated accounts will be shown along with the default UDM groupings that begin with KPI_. You can now enter or copy and paste accounts from your ERP to the appropriate KPI_ grouping. Each line is saved automatically as you move to the next. These KPI groupings are used in the pre-built financial reports and dashboards that were imported from the SEI UDM template.
As you can see, each ERP has it’s own account structure but will be mapped to a common UDM grouping.
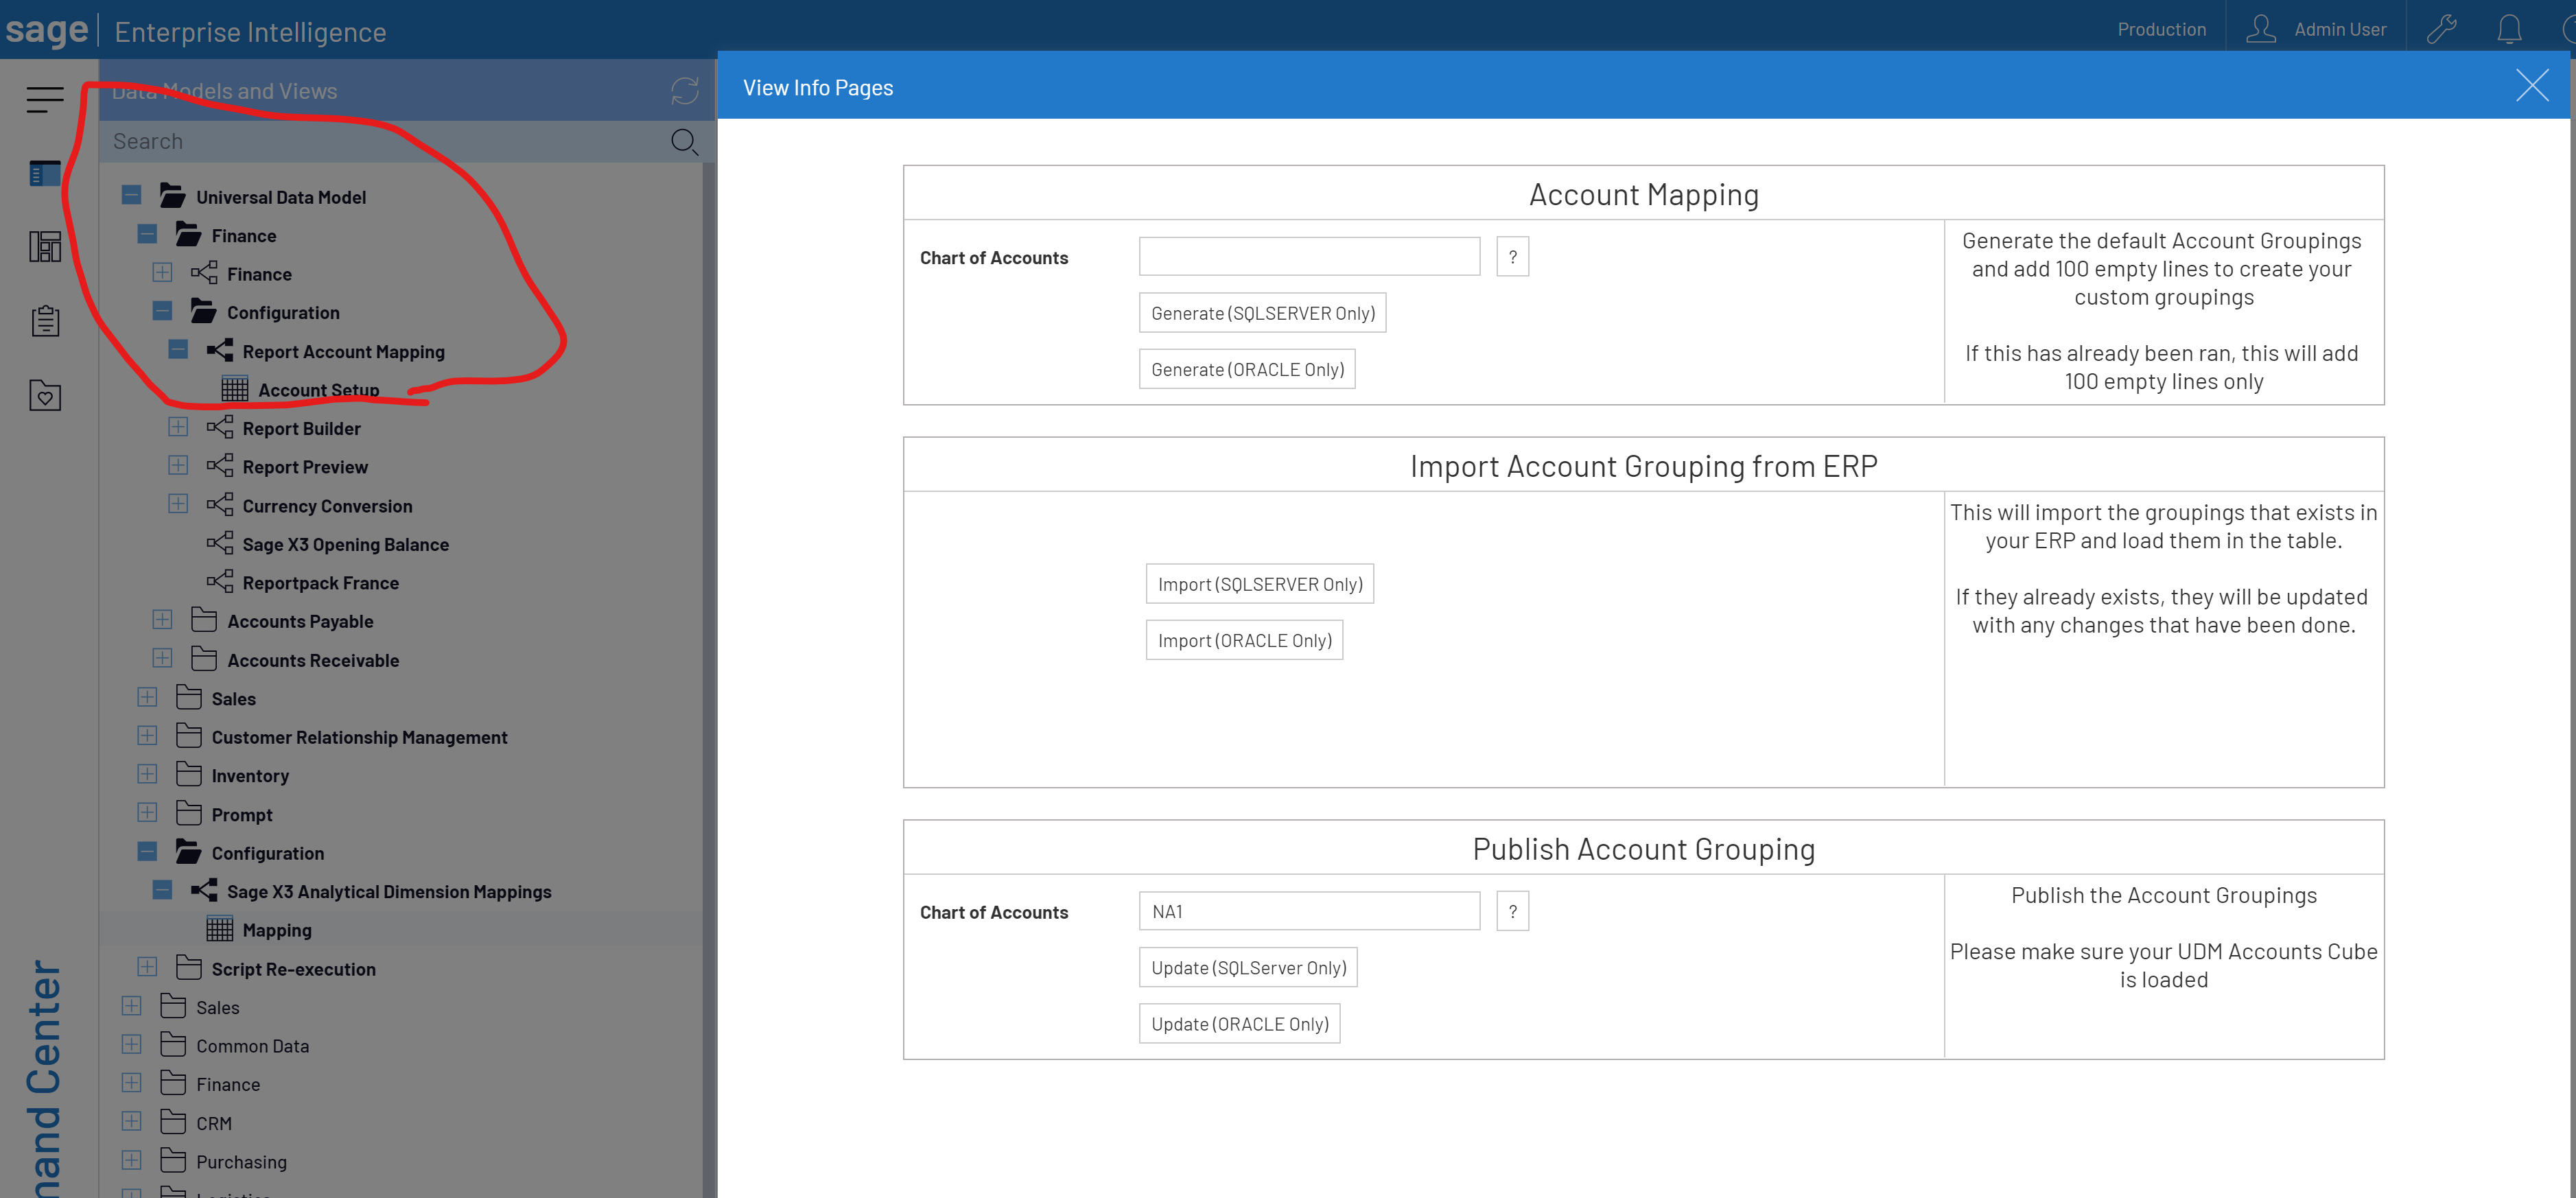
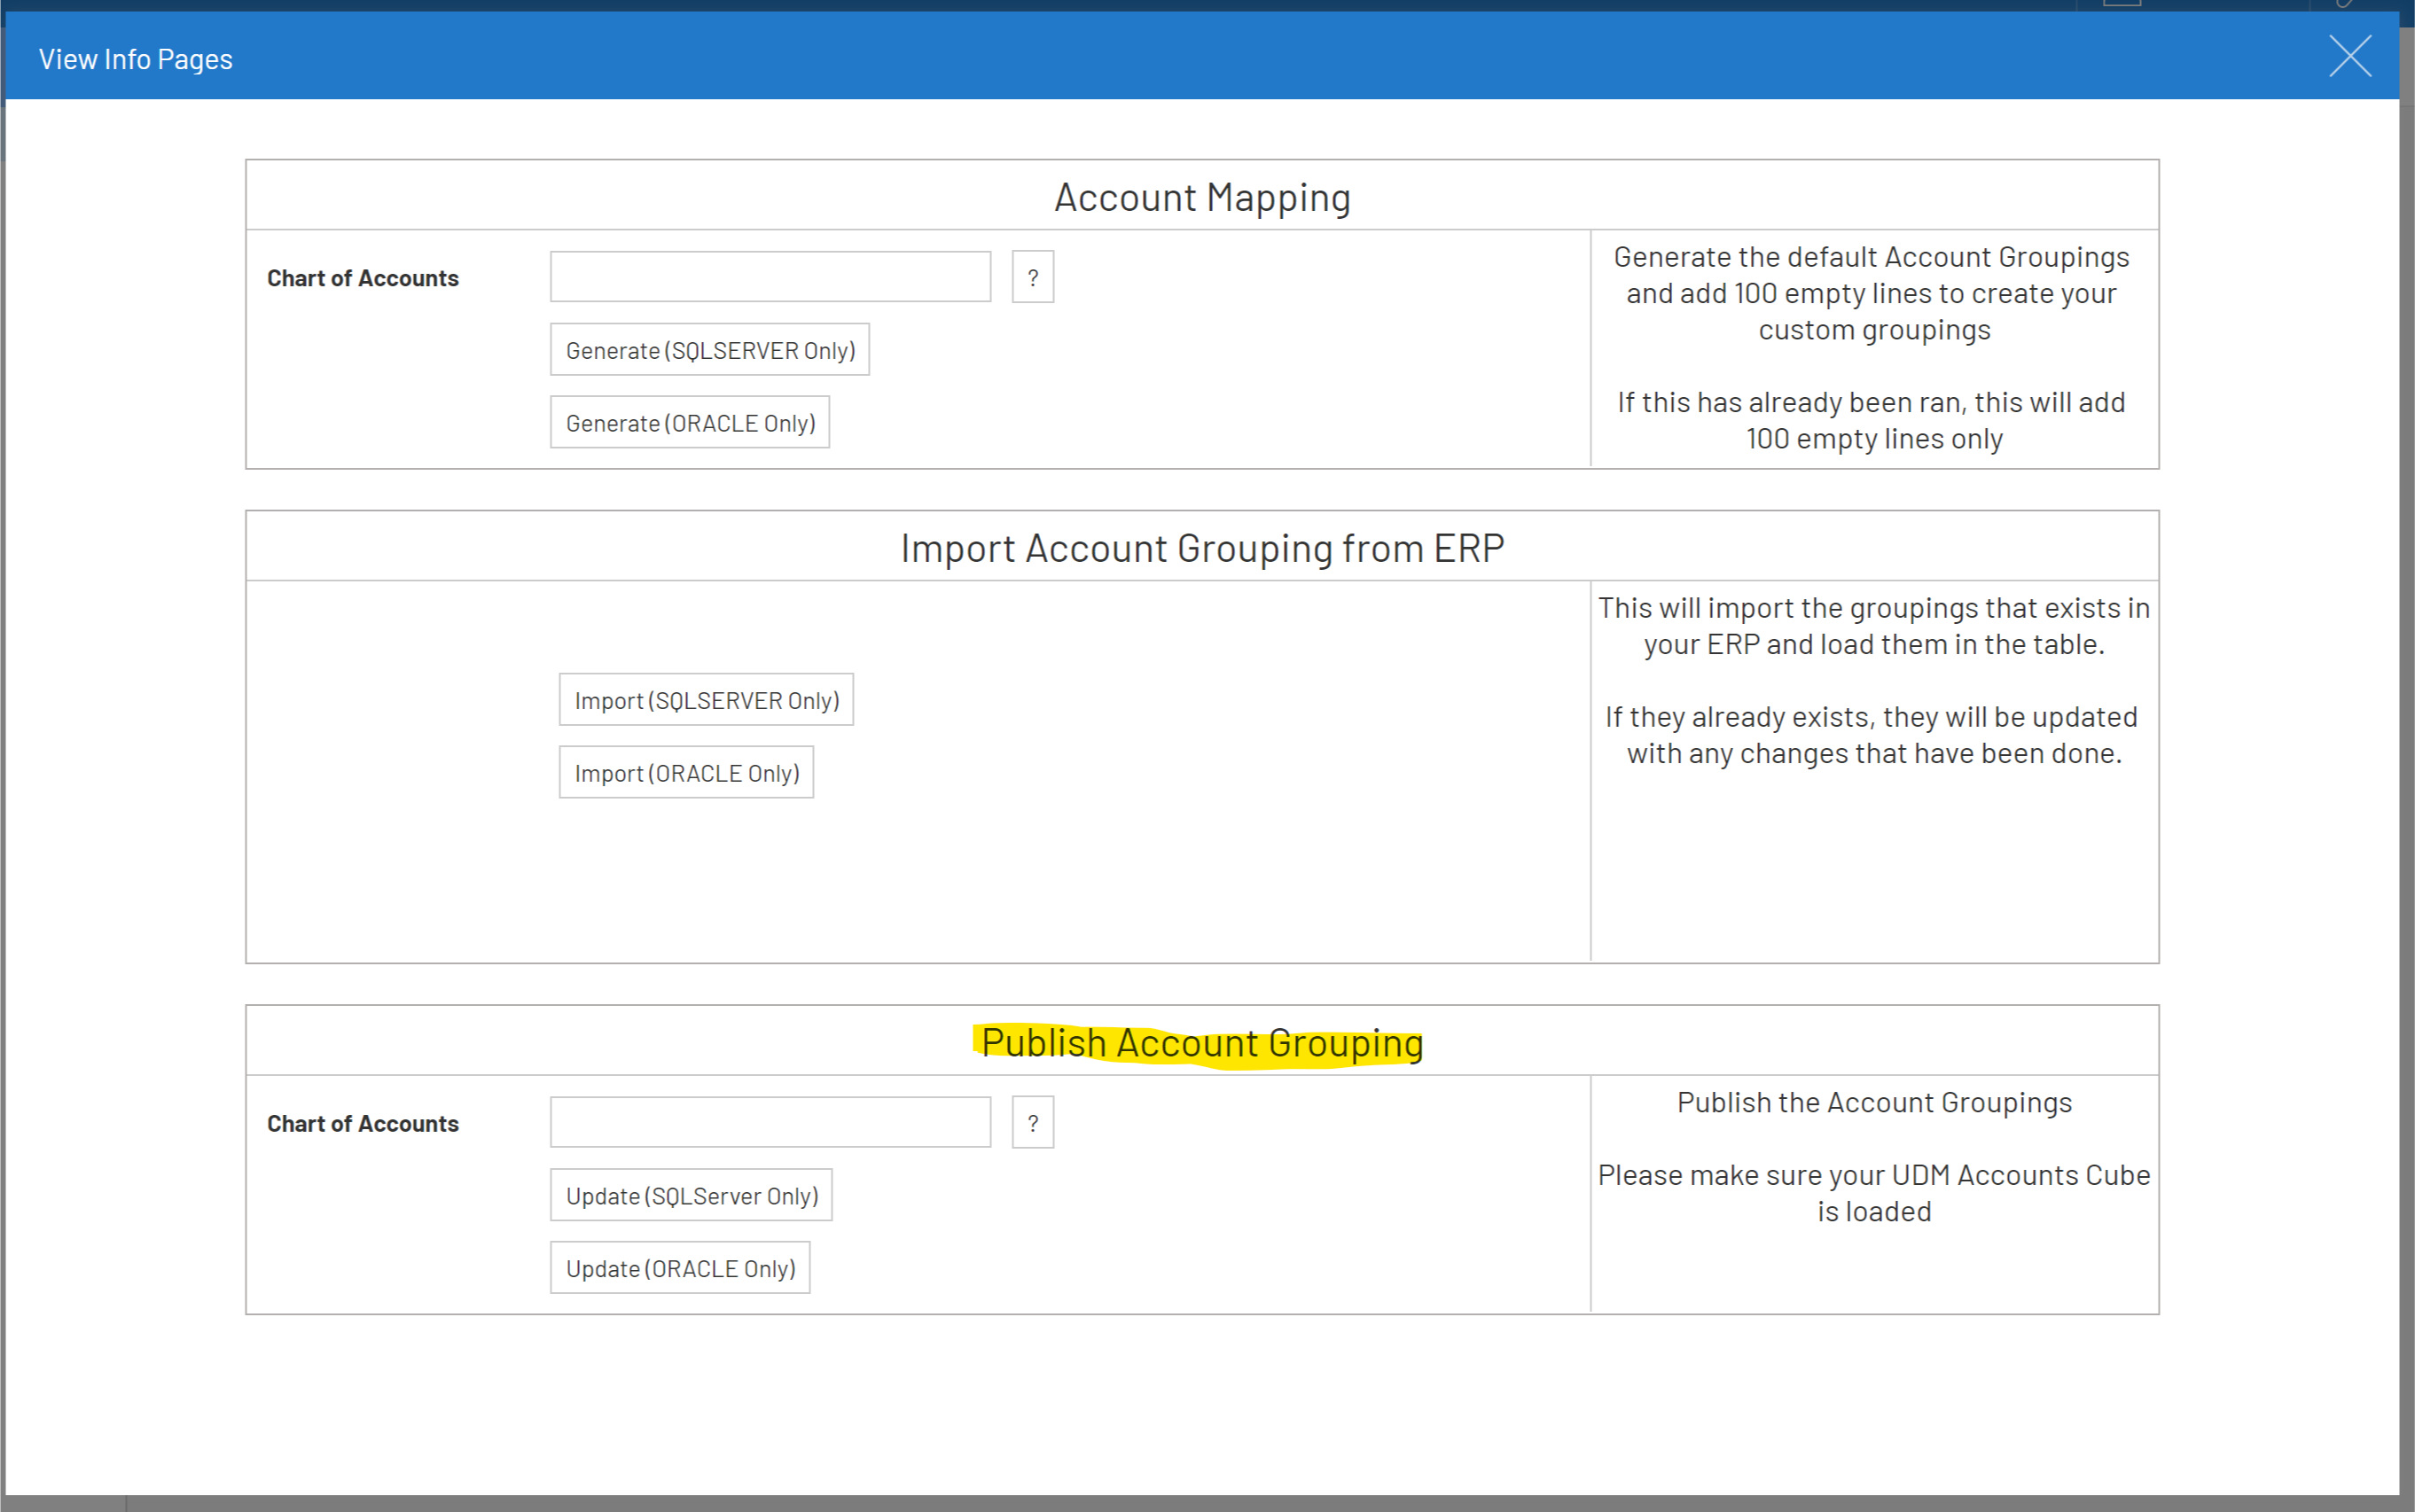
After mapping, you can now publish your groupings for each chart of account by launching the Report Account Mapping data model view info page.
If you notice that account(s) are not mapped to the correct category or new accounts have been added, you can repeat the mapping process and publish the chart of account grouping again. Changes will be available after manually refreshing the UDM cubes or on their next scheduled refresh.
SEI Report Builder
The Report Builder shows the default UDM financial reports and layouts but you do have the ability to create your own new report layouts using the builder blueprint.
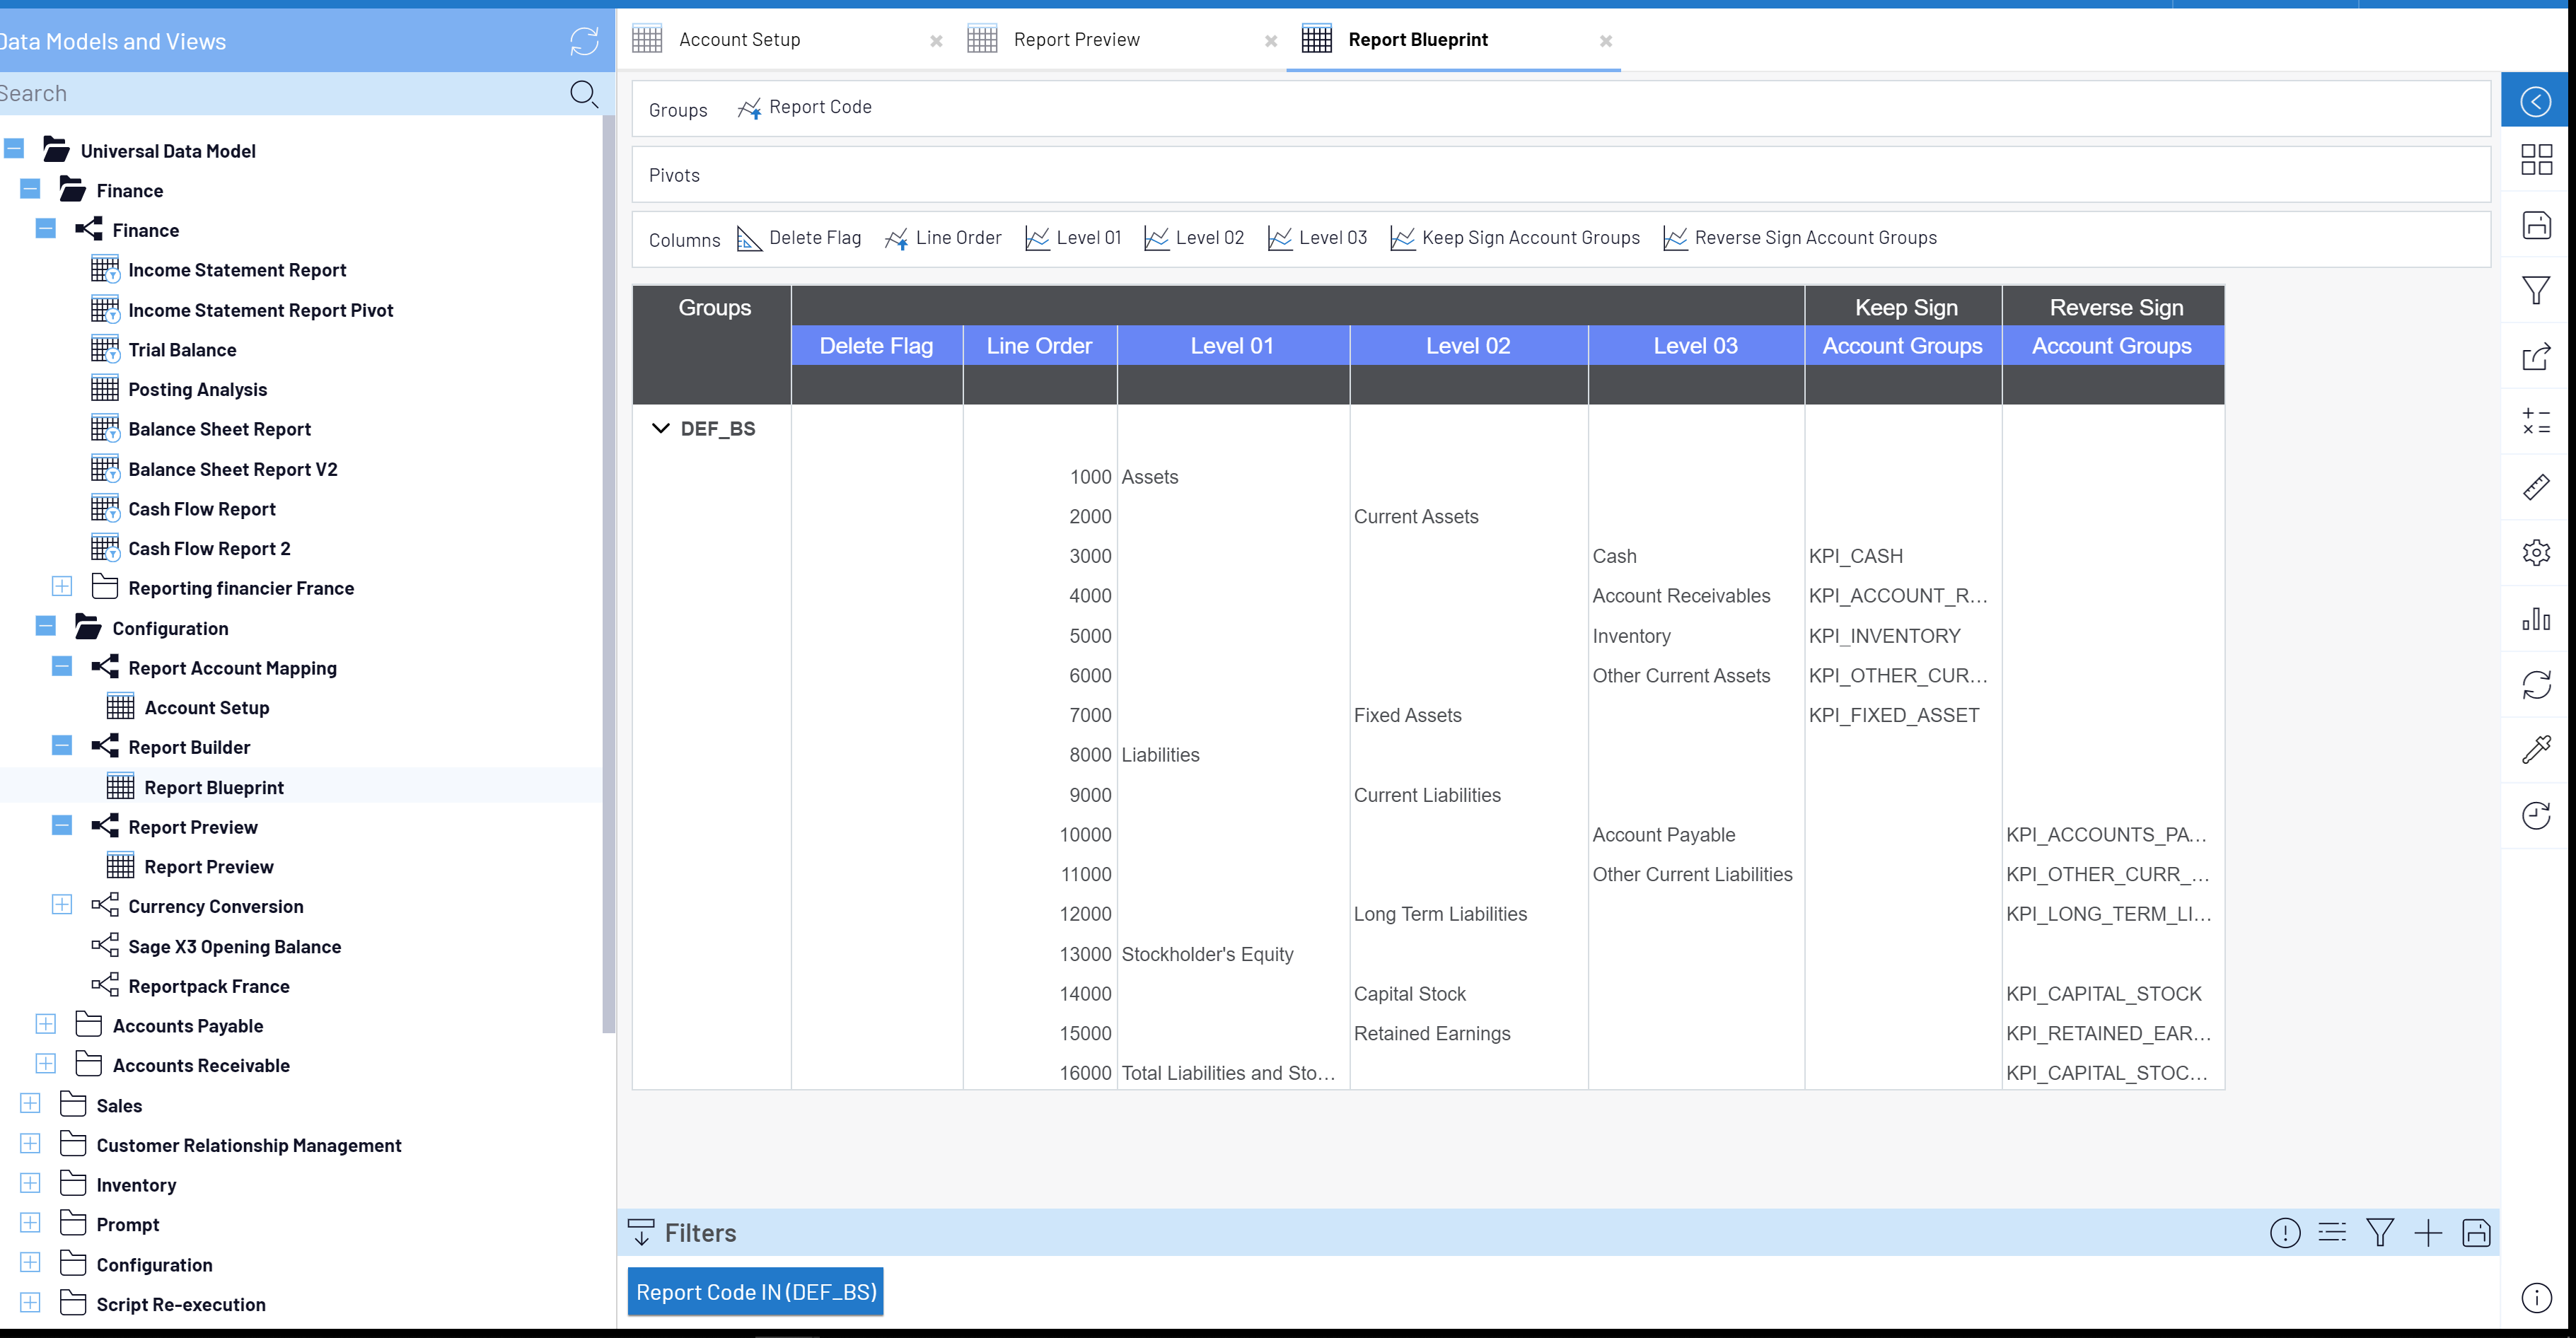
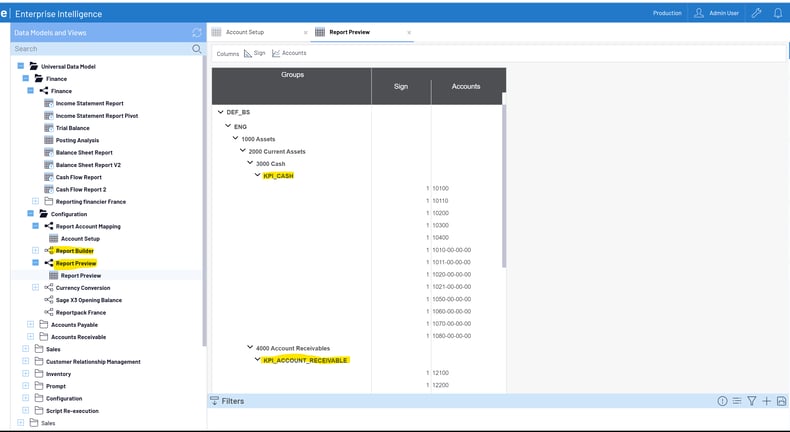
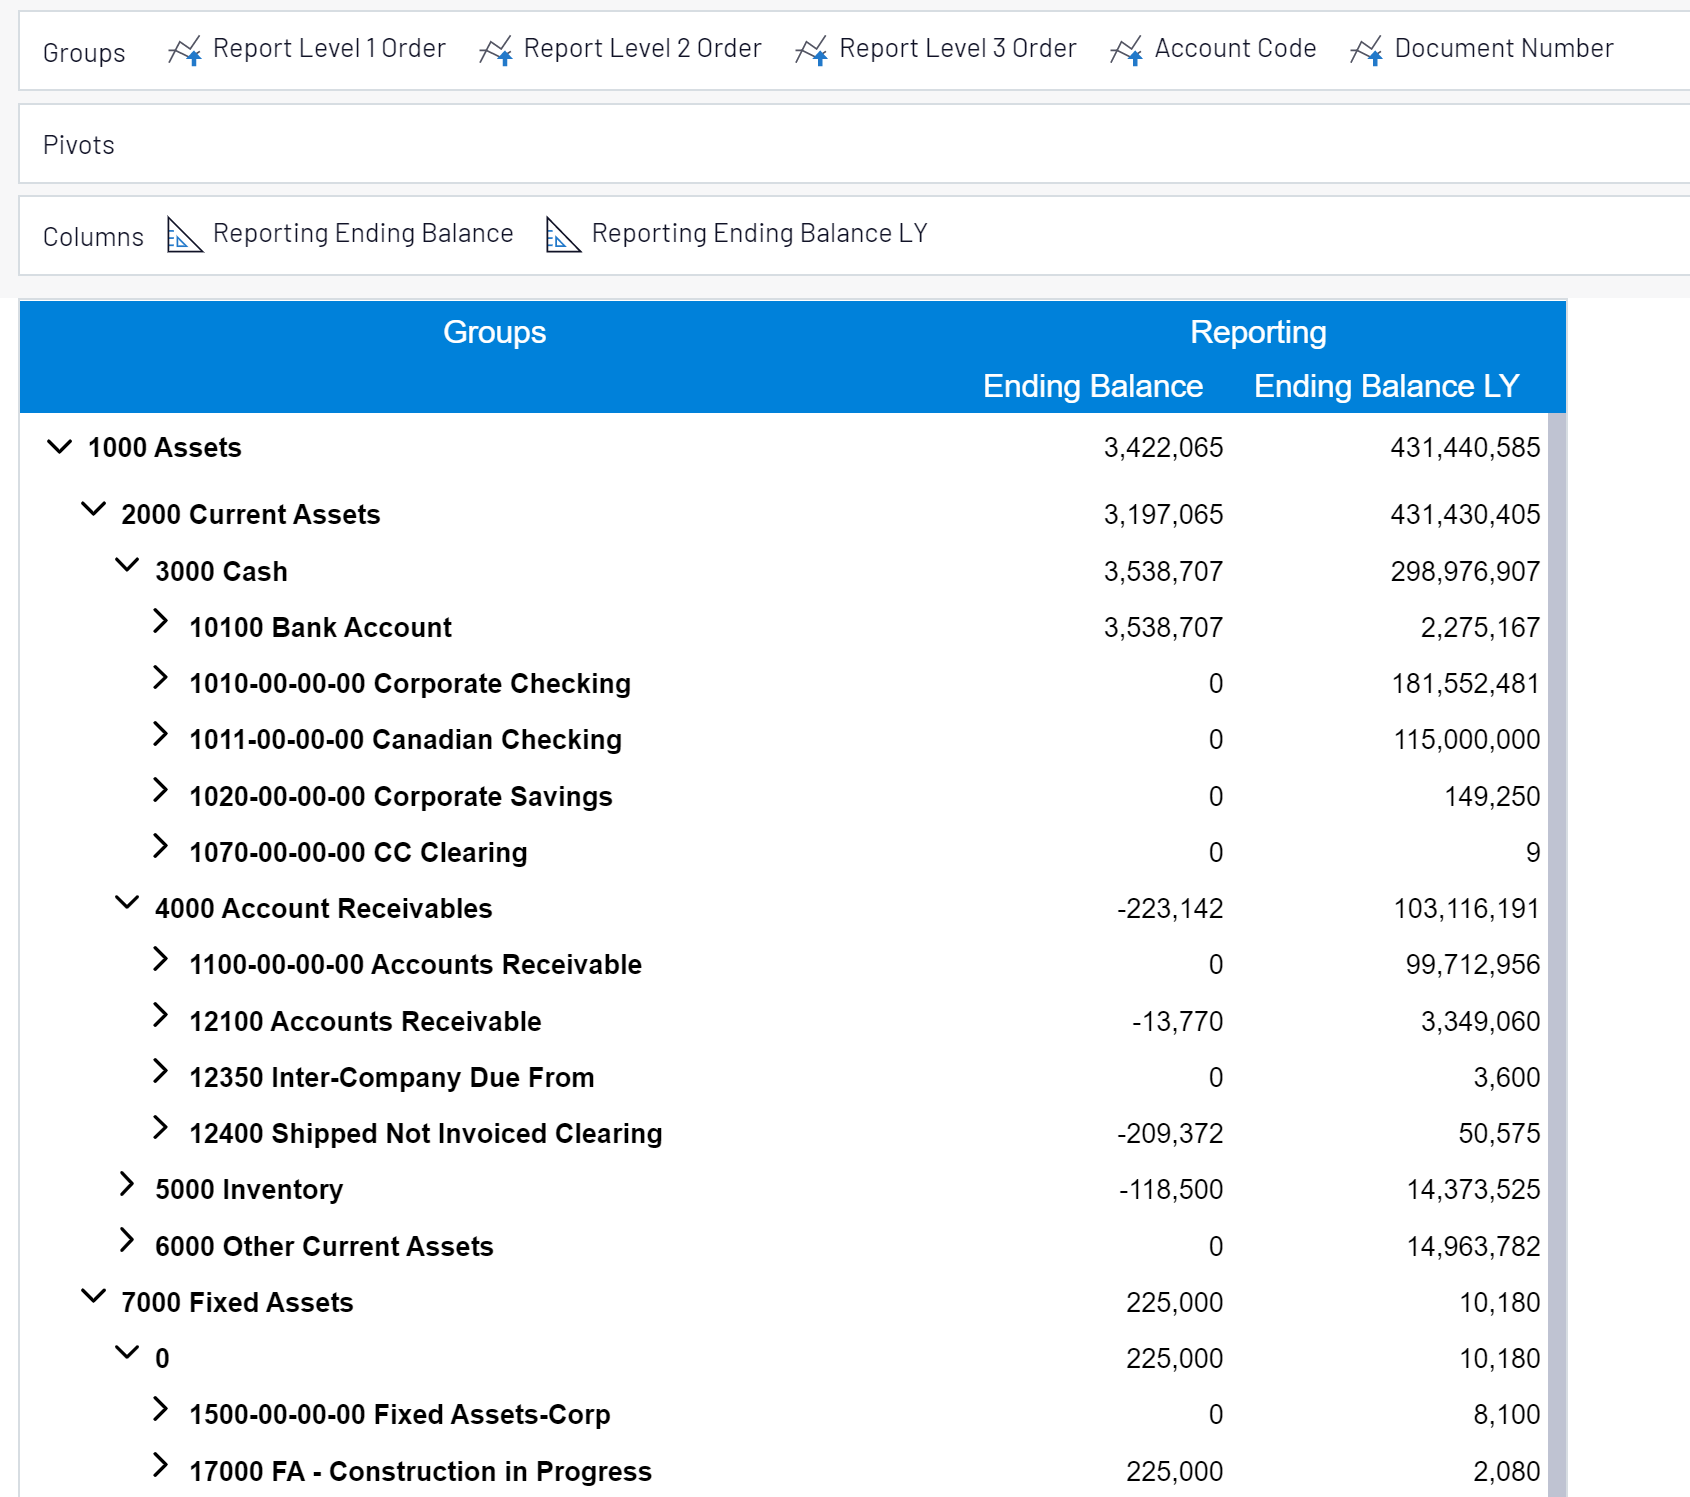
Running the Report Preview will show you each account you have mapped to its respective groupings in this report.
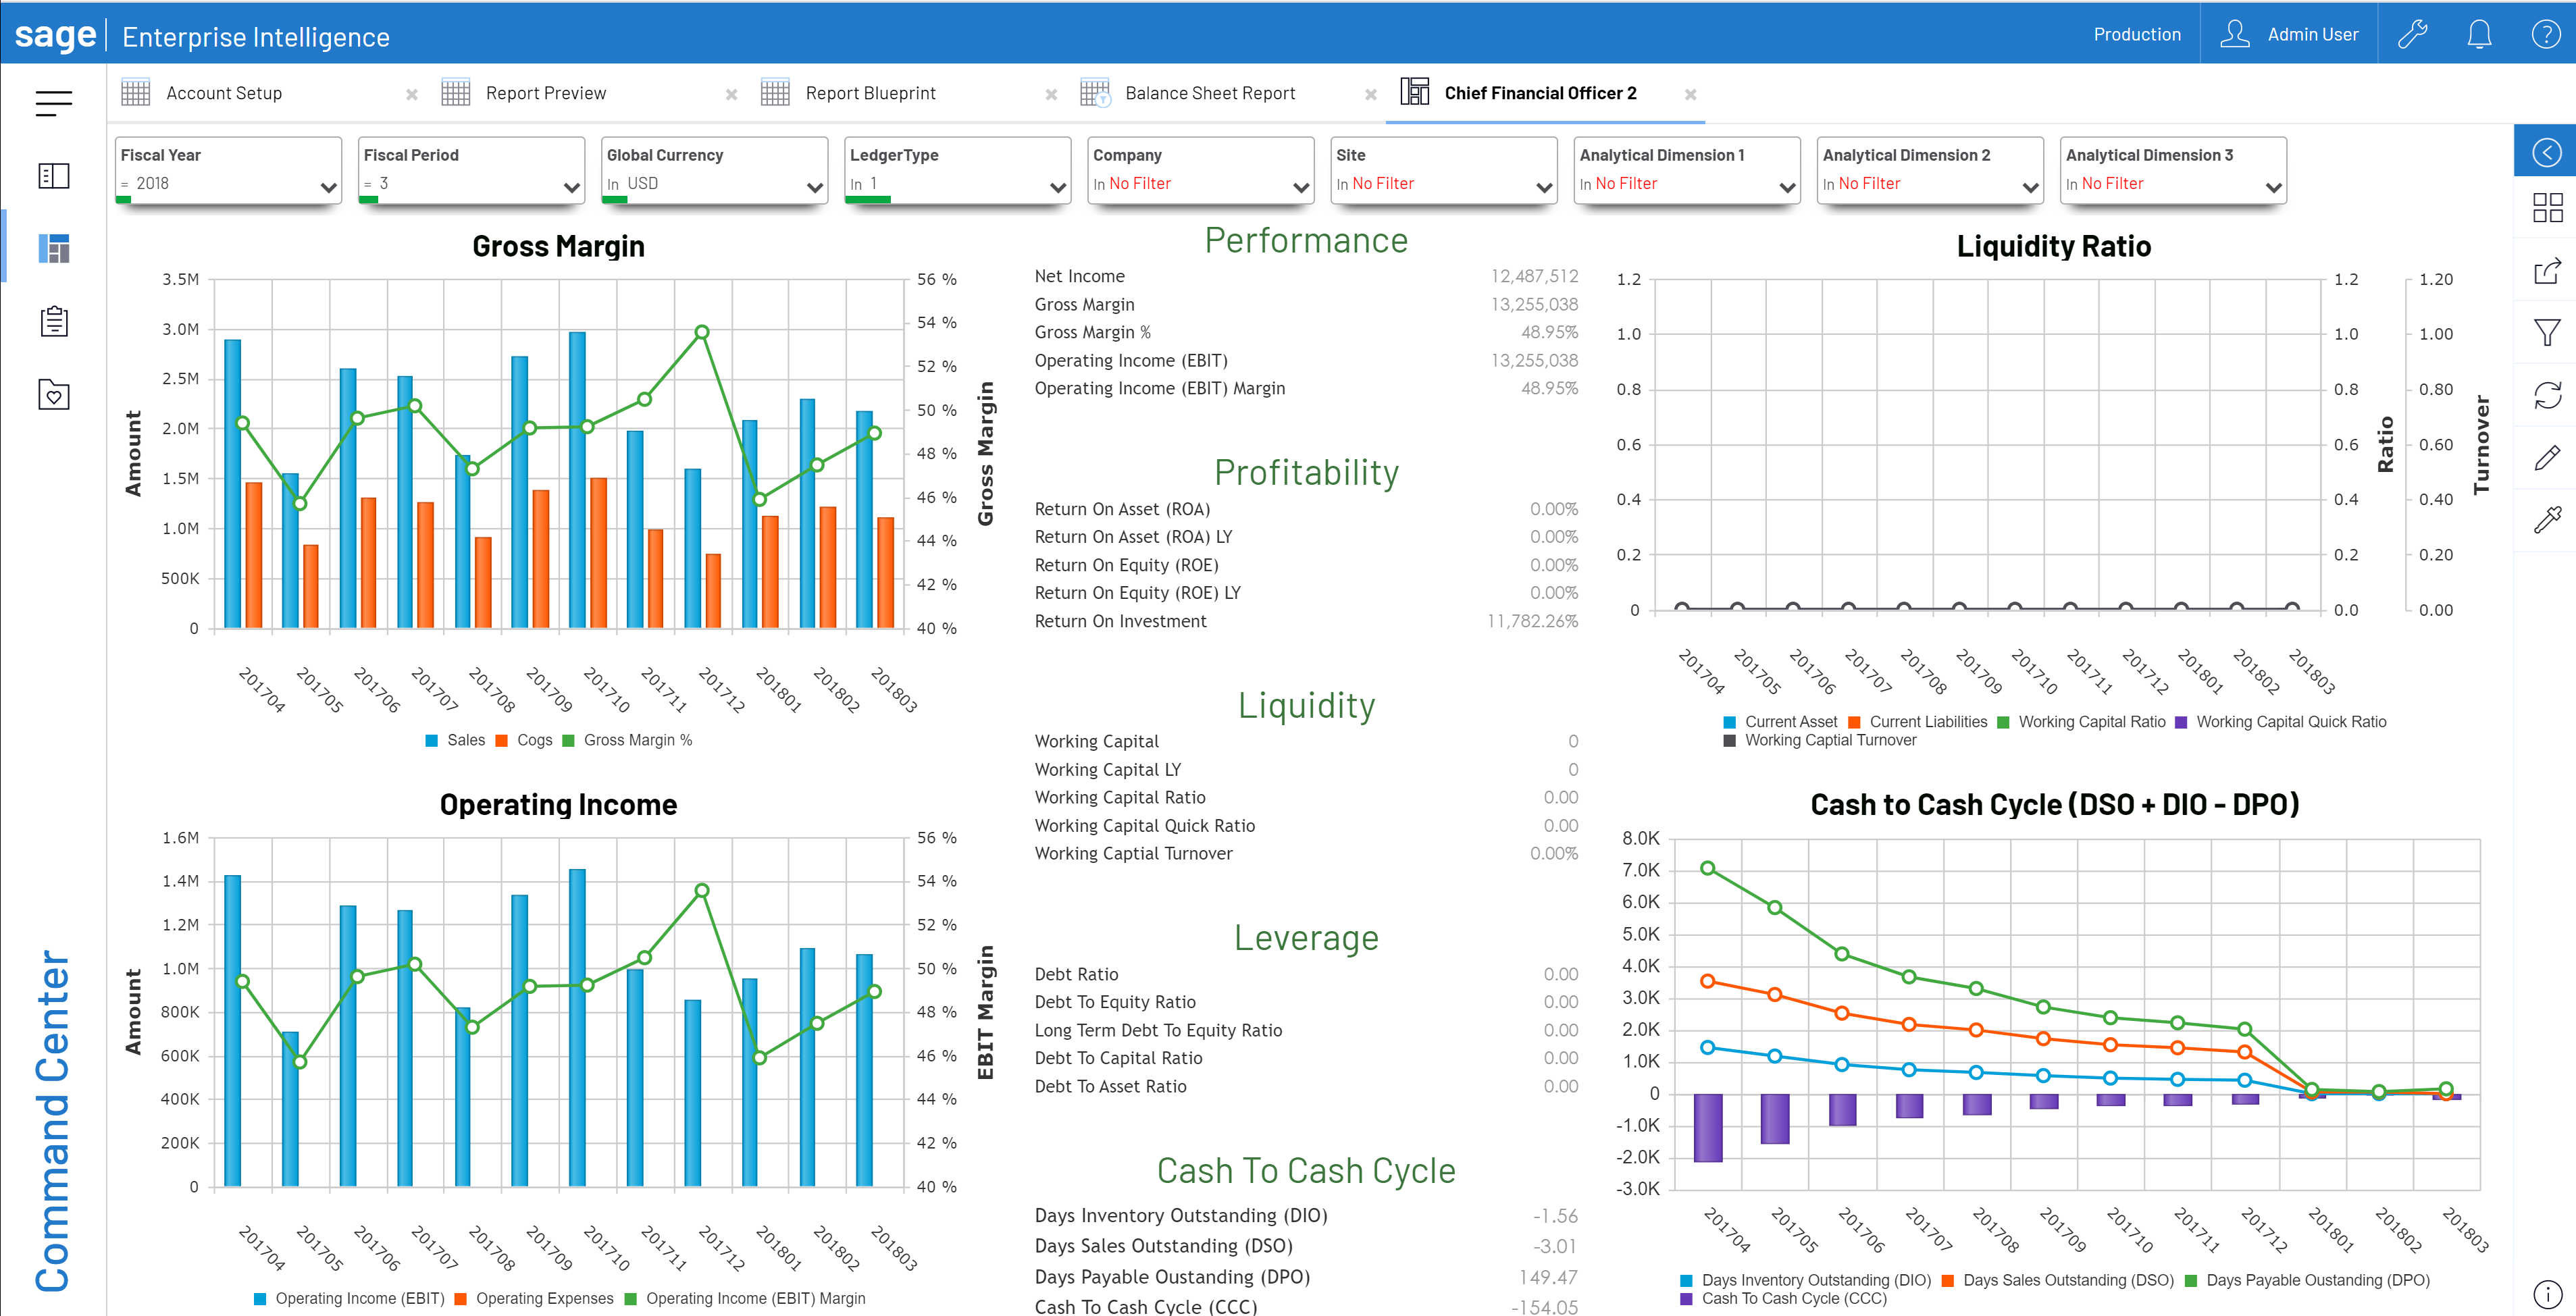
If your mappings are correct, you are now ready to utilize the built in financial reports and dashboards in the Universal Finance Data Model. Below are examples of the Balance Sheet and CFO dashboard.
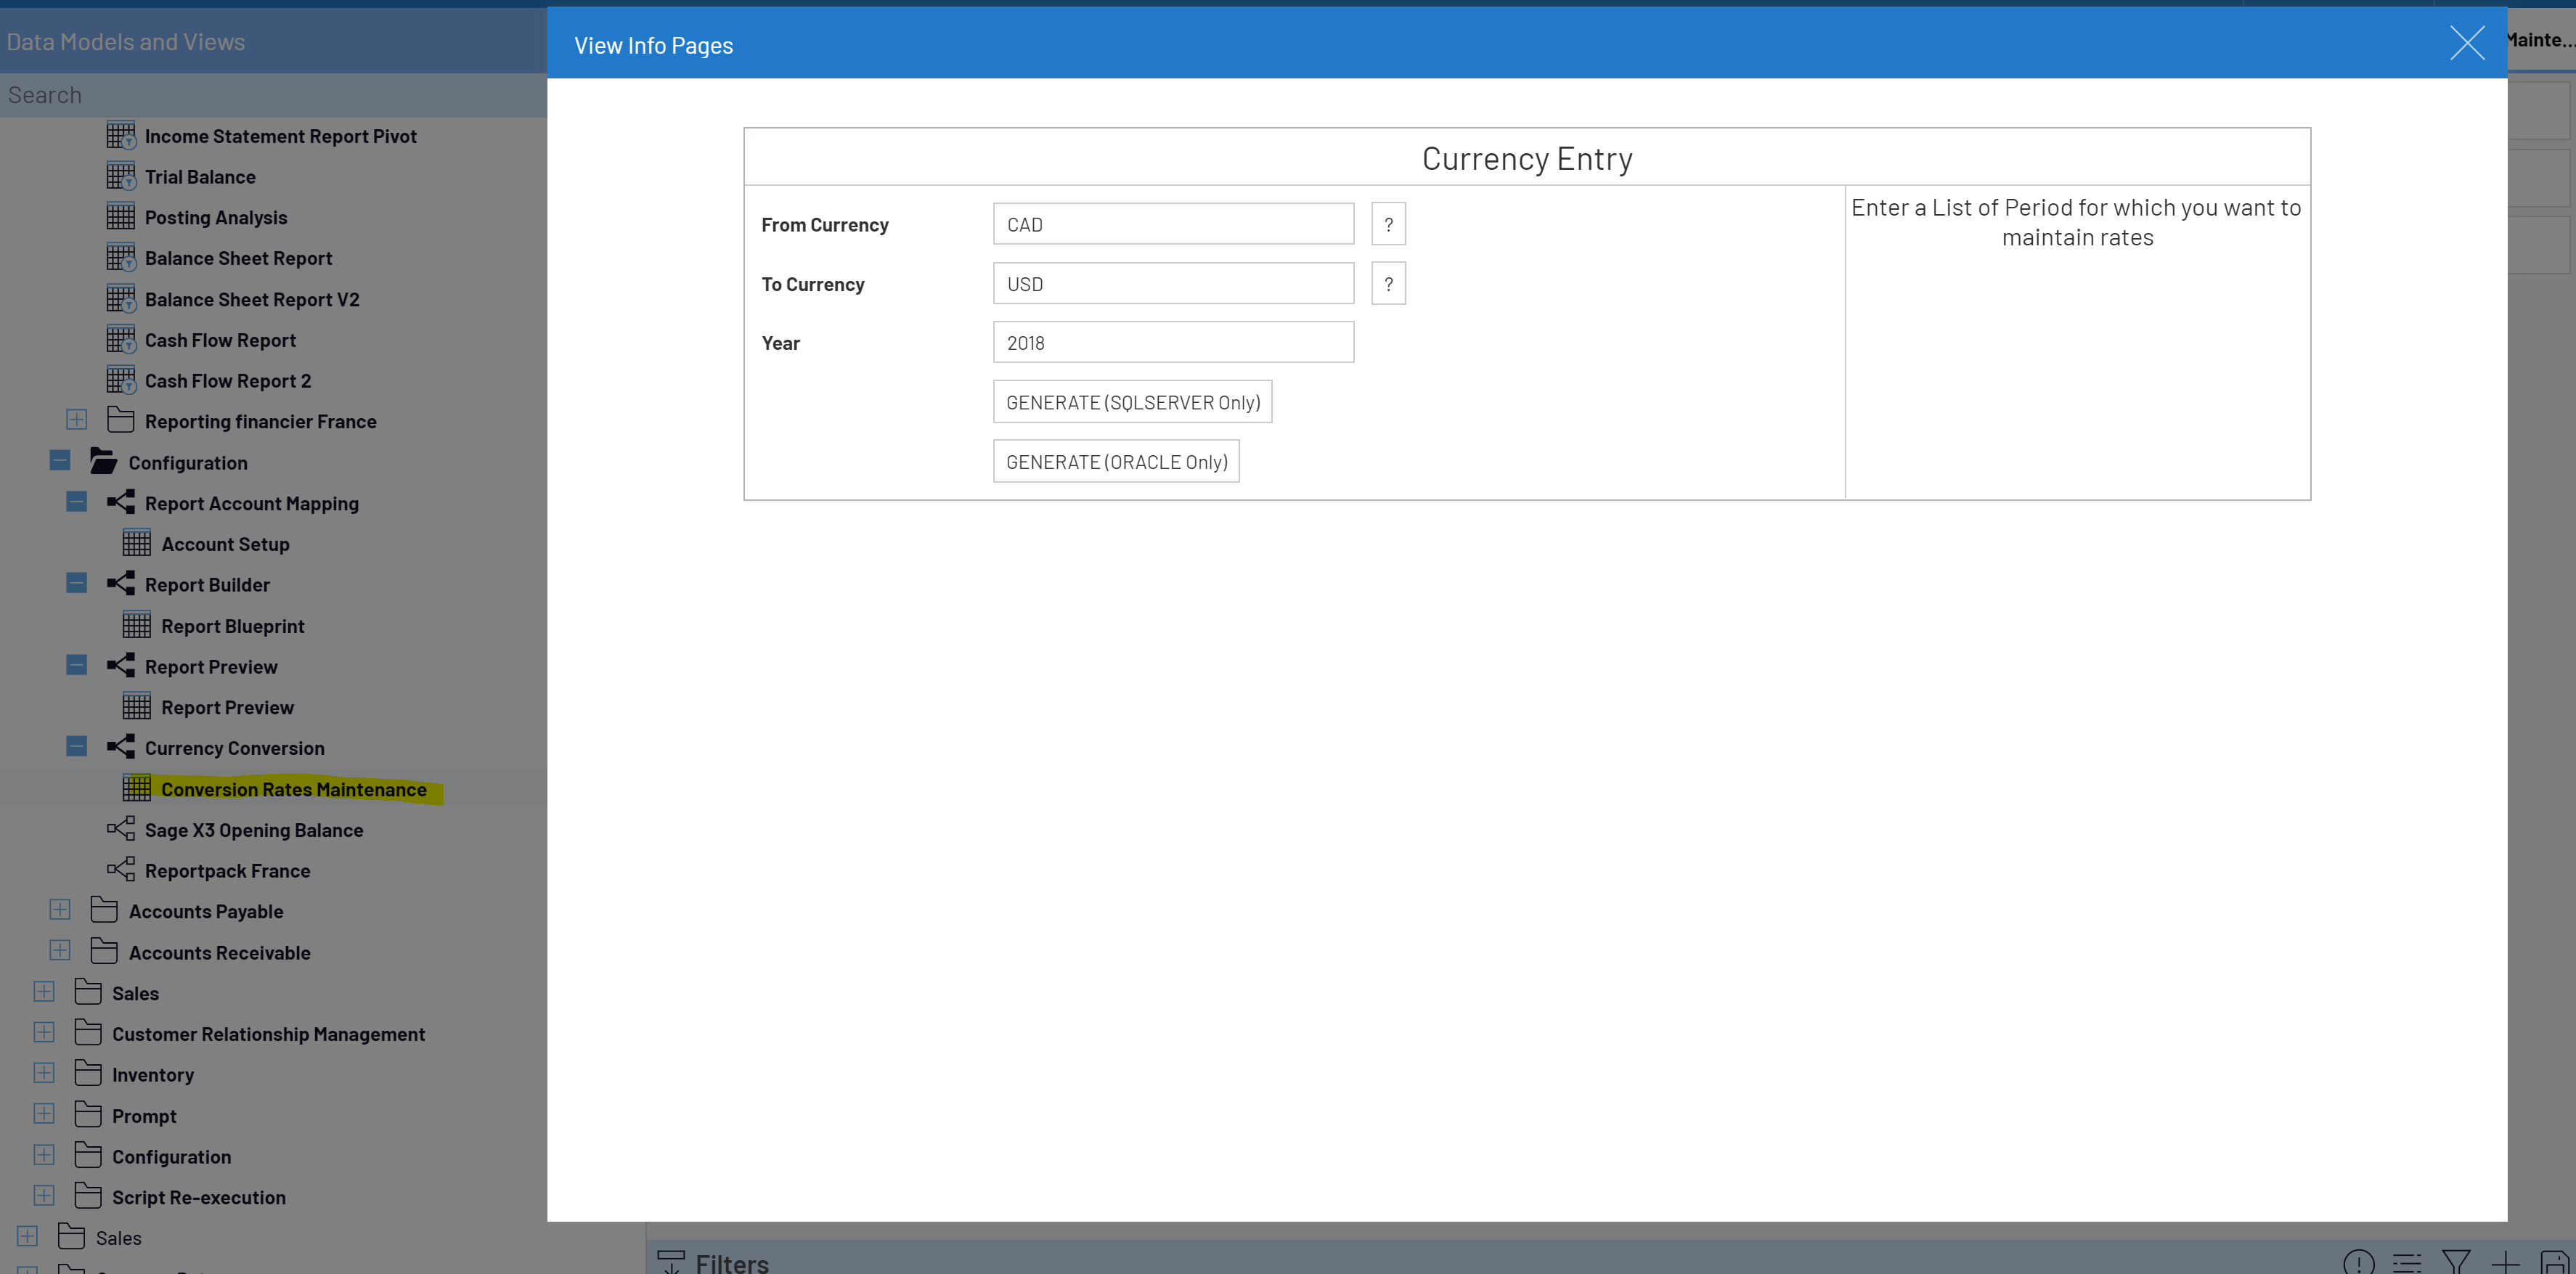
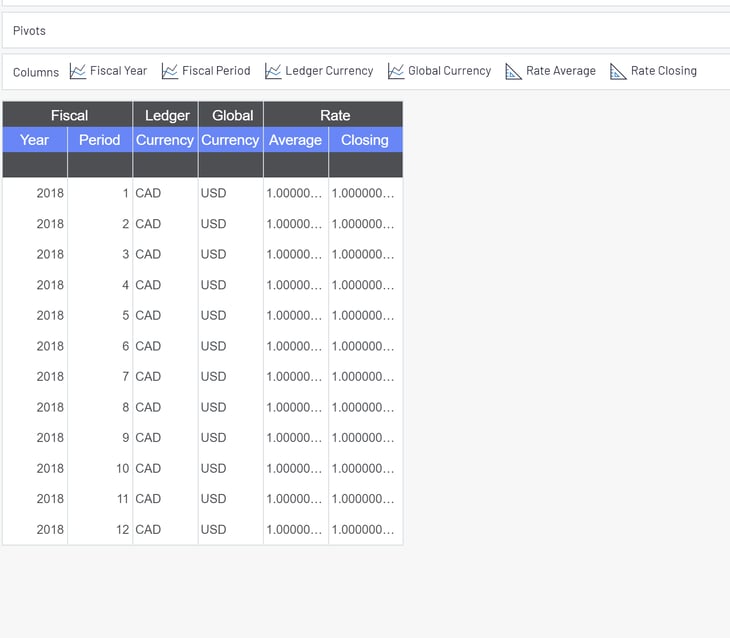
If you are working with multiple currencies and global entities, the SEI Universal Finance Data Model has currency conversion capabilities with the ability to enter the monthly conversion rate average and closing for use on the combined reports.
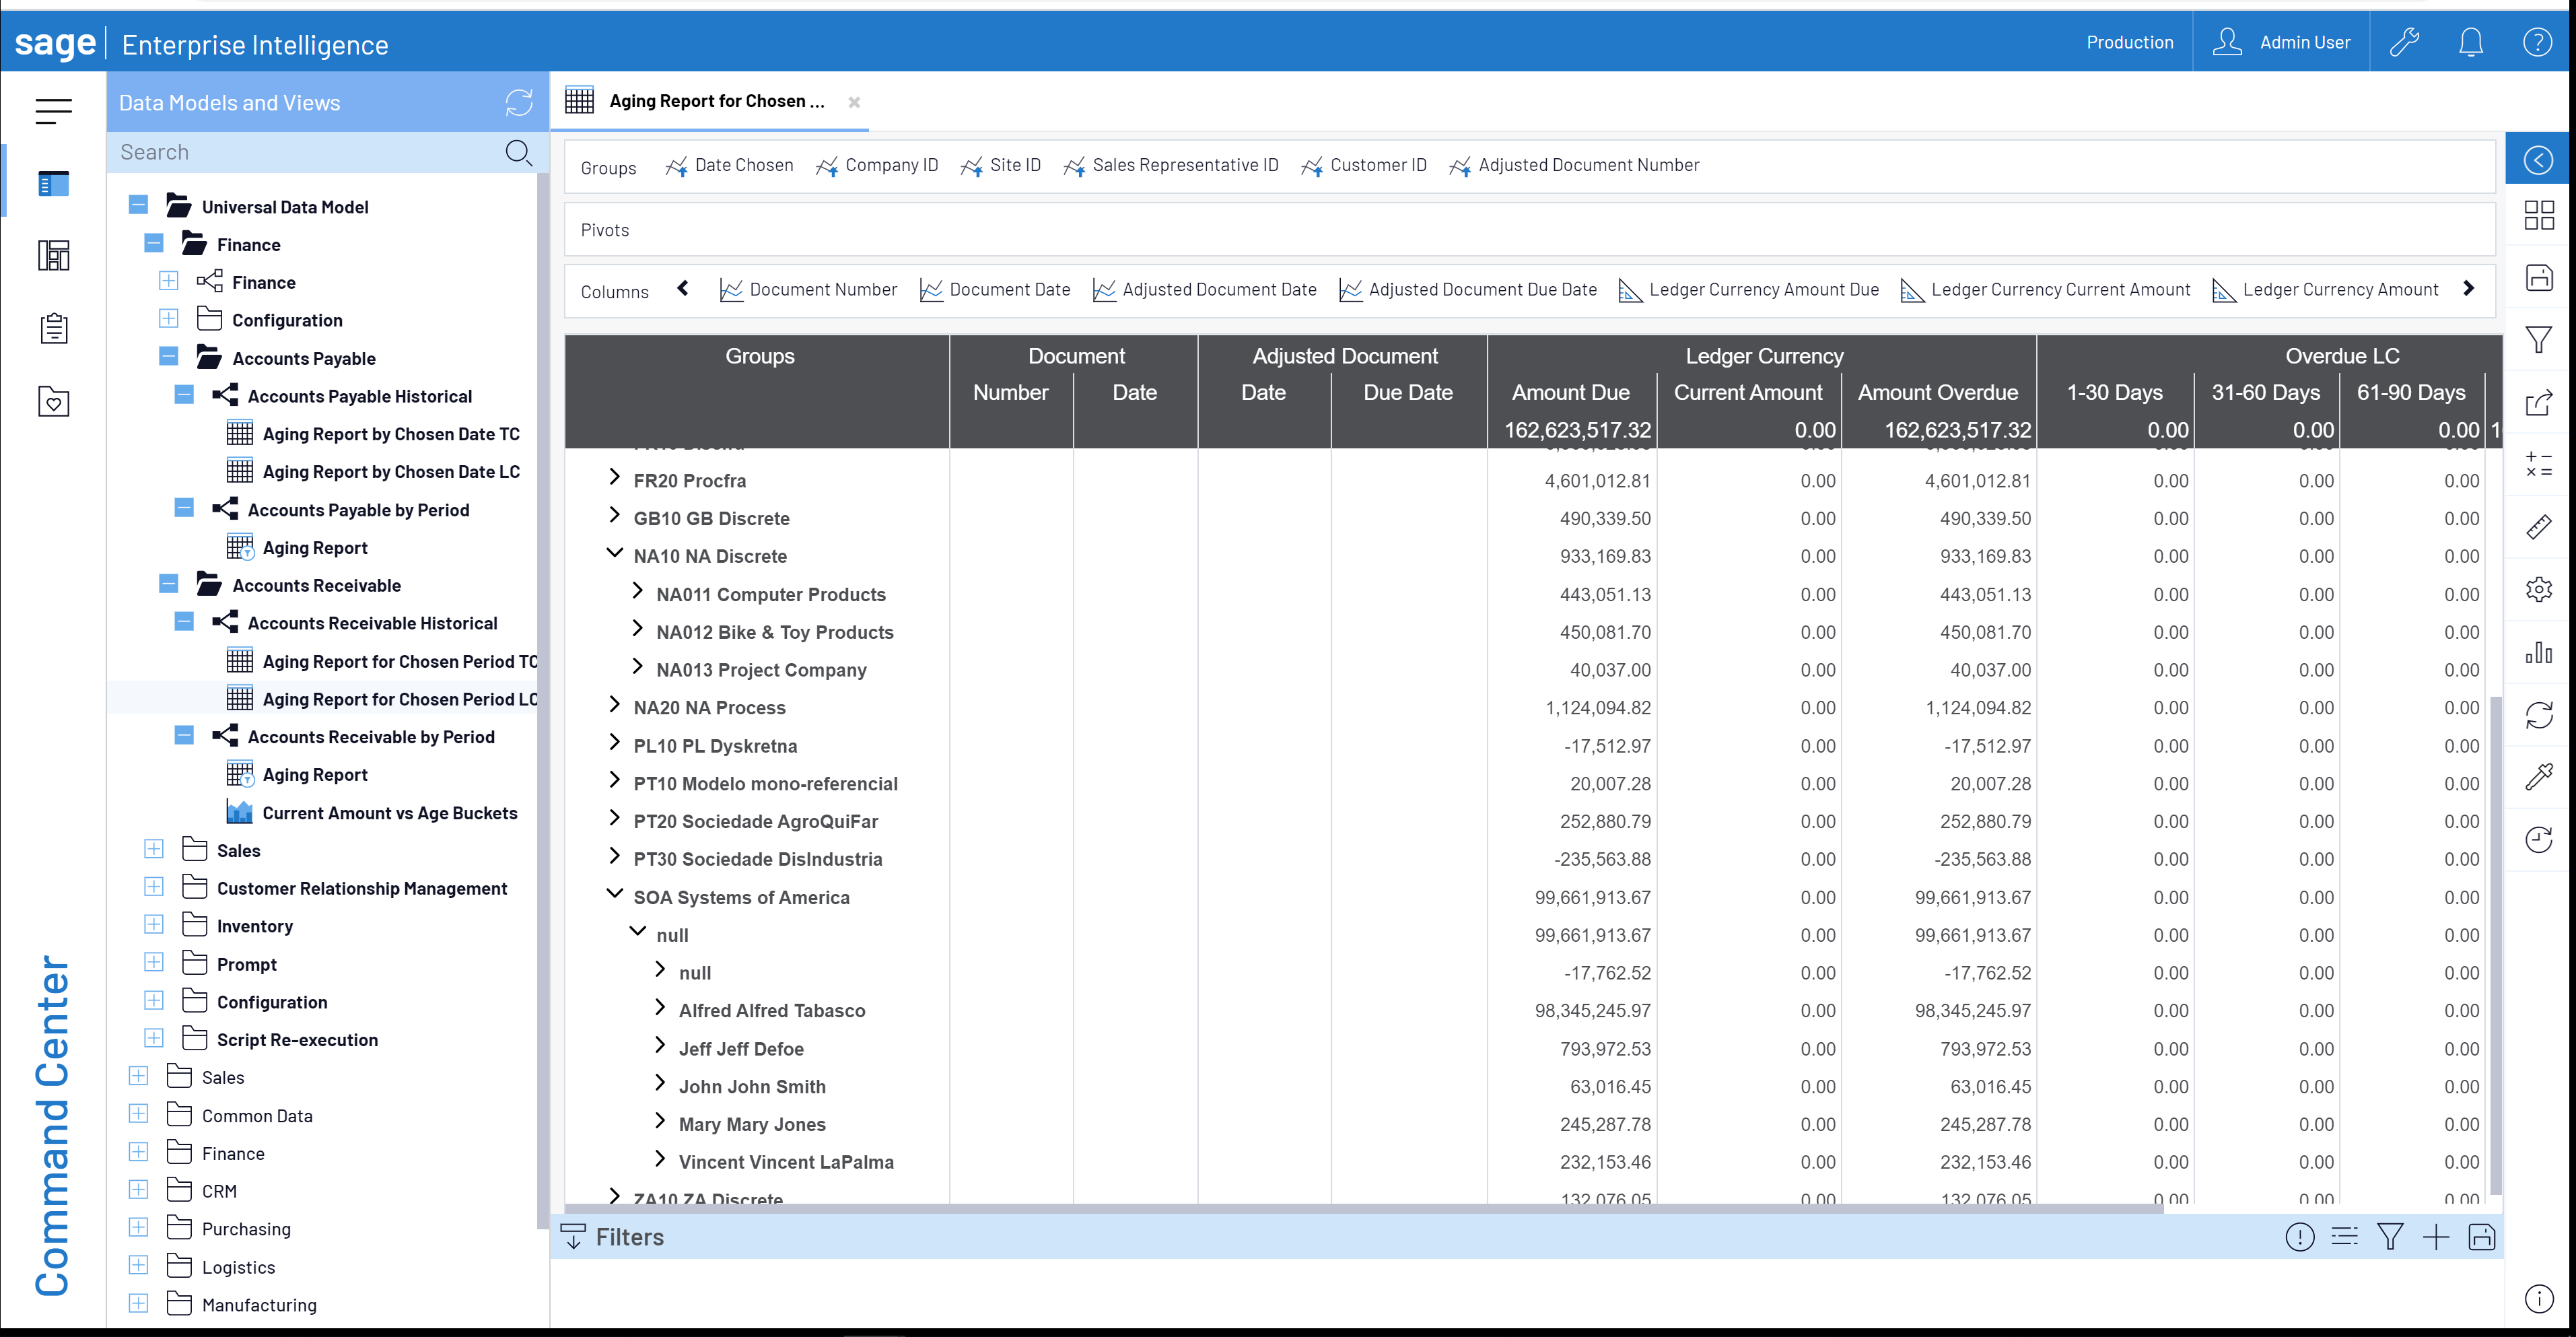
With SEI filtering, you can now run combined financial statements and dashboards or select individual chart or accounts, companies, etc. to have more detailed reporting. In addition, the Finance UDM template also includes data models combining AP and AR data between systems so that combined AP and AR agings and historical as of agings are available.
The Universal Finance Data Model template is a great way to start using SEI and generating financials and key performance indicators out of the box!
Need more help with Sage 500, Sage X3 or SEI? Contact us so we can review what you've got going on.