

Speaking at the Supply Chain Insights Global Summit September 2013, Rick Sather, Vice President – Customer Supply Chain for North America Consumer Products, told a rapt audience about how Kimberly-Clark made its very successful transition from a “push”-driven to a demand-driven supply chain.

Kimberly-Clark (K-C) has a supply chain that runs from raw materials (such as trees for pulp) to the consumer bearing hundreds of familiar brands.
Sather told us that, “for decades upon decades in” K-C, the supply chain concept was “make and push” product out the door. The firm operates huge machines—machines two and three stories tall—to manufacture some of its products. The capital investment in such equipment tends to make management believe that the machines must be run 24 hours a day, seven days a week, with a minimum of down-time for set-ups. As a result, attempting to introduce “LEAN” and “demand-driven” as management concepts had formidable hurdles to overcome.
Beginning as late as 2005 (I, personally, would have thought these concepts would have prevailed earlier in Fortune 500 firms; but I was clearly wrong), K-C has steadily moved from large batch runs to small batches run at more frequent intervals as demand dictates.
The “Bullwhip Effect” is Alive and Well
“The ‘bullwhip effect’ is still alive and well,” Sather affirmed. And K-C is still working through a process of ongoing improvement (POOGI) in its attempt to “align the lines,” as Sather calls the efforts to bring into alignment the lines generated by forecasts, actual shipments of products, and the shelf take-away (or end-user consumption).
What Sather and K-C’s experience clearly demonstrates, however, is that synchronizing the flow of product through the supply chain through agility and shelf-back sensing is the real key to increasing both top-line and Throughput performance. Sather flatly stated that K-C has seen “millions of dollars of improvement on one [a single] SKU” as a direct result of their new LEAN approach and self-back sensing.
Promotional activity (read: policy-induced demand variability) used to result in a bad—and costly—mix of too much inventory in some stores while other stores suffered “massive out-of-stocks.” Now, Sather and his team have been able to move far more product with far less disruption and consternation with the help of critical supply chain changes:
- Near real-time feedback on end-user consumption
- More flexible LEAN production measures
- Smaller and more frequent replenishment
While the shelf-back sensing aspect of this improvement may be attributed to Big Data (or, more appropriately, “fast data”), the production flexibility and more frequent replenishment are both aspects of agility. Demand visibility and agility are the cornerstones of “aligning the lines”—that is, synchronizing flow with demand.
Looking for the R.O.I.
Unlike some supply chain managers, who somehow come to believe that ROI is impossible to calculate or measure on some efforts, Sather told the Summit audience that, in everything K-C does with regard to their supply chain improvements, they “tie [it] back to expected outcomes.”
Some supply chain managers have settled themselves on the concept that, because precise figures cannot be known, it is, therefore, not worth the effort to calculate or measure results of POOGI efforts. This is wrong-headed thinking, in my view.
While I agree that the exact numbers cannot be known, it is far better to be “approximately right” and prepare estimates for the key factors affected by any improvement effort than it is to make no effort simply because you know the estimates will be “precisely wrong.”
The critical factors that should be considered in calculating ROI for any given improvement are these:
- Change in Throughput [T] (where T is defined as revenues less only truly variable costs)
- Change in Investment [I] (where I is defined as inventory or other investments require for the proposed improvement)
- Change in Operating Expense [OE] (where OE is all the other moneys paid out over the calculation period not included in T or I)
-
The simple formula for calculating ROI for any improvement project may be stated as follows:
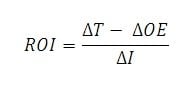
Where delta-T = the change in Throughput, delta-OE = the change in Operating Expense, and delta-I = the change in Investment.
Great Take-aways
While Rick Sather’s presentation covered more—and, perhaps, I will yet cover other aspects in another article—here are the key elements I took away from his presentation on Kimberly-Clark’s journey toward a demand-driven supply chain:
- You will need a champion to overcome the inertia of the organization
- Demand visibility and supply chain agility are the keys to improving Throughput
- Every improvement effort should be tied-back to expected results
We will be writing more about what was learned at first annual Supply Chain Insights Global Summit 2013 in the near future. Stay tuned right here for more in the near future.
Give us your feedback. Feel free to post your comments here, or contact us directly, if you prefer. We would be delighted to hear from you.