

 Are your supply chain planners and production decision-makers constantly evaluating, examining, considering, checking and double-checking screen-after-screen, row-after-row, column-after-column of numbers in printed reports, in your ERP system, or in Excel™ workbooks trying to make decisions that are timely, accurate and effective?
If you answered yes, chances are they are looking at numbers like…
- Quantities on-hand
- Quantities on open replenishment orders
- Quantities required for open sales orders or work orders
- And more….
The Genius of Simplicity
The genius of DDMRP (Demand Driven MRP) and its closely-related DDSOP (Demand Drive S&OP) is that it boils metrics down to two easy-to-understand elements: a color and a number.
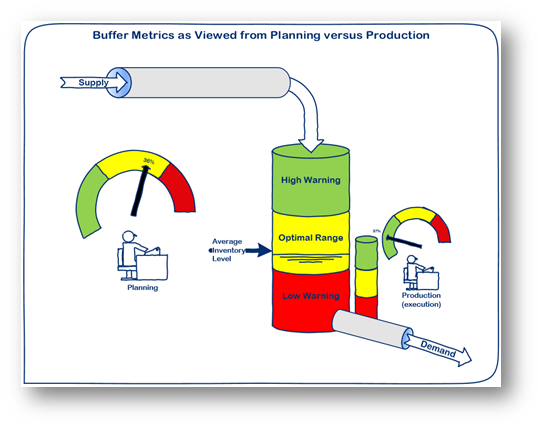
From the SUPPLY CHAIN PLANNER and MANAGER's point of view, all the quantity factors are already included in the visual elements presented. The factors incorporated are:
- Current On-Hand Quantity (in any given SKU-location, designated a "Buffer")
- Quantities on any open replenishment orders
- Quantities required for any open demand that is scheduled for shipment or consumption today or before today (e.g., backorders)
- Quantities on any qualified demand spikes within the determined spike horizon [1]
- Planned adjustments for any known or anticipated changes in demand (e.g., special promotions) [2]
- Average daily usage (ADU)
- Minimum Order Quantities (MOQ), if applicable [3]
- Demand Variability
- Supply Variability
No more looking at rows and columns of numbers. For any given item, the planner might be looking as something like this:
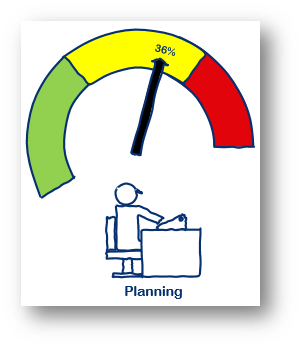
This SKU-Location (SKUL) has a PLANNING buffer in the YELLOW ZONE at 36 percent of total buffer.
From the Execution Viewpoint
The folks whose responsibilities are related to execution—say, production or shipping—would be seeing something entirely different, however.
Someone on the shop floor might be seeing something like this (below) with regard to the same SKUL the planner is viewing above:
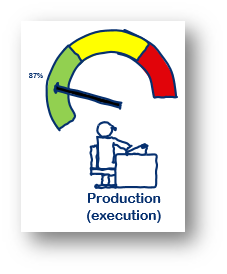
Since the execution team is interested only in quantities on hand necessary to serve the immediate demand, they would be seeing a different version.
From a PLANNING perspective, the actual on-hand quantity will normally reside in the YELLOW ZONE (typically, the lower half of the YELLOW ZONE). Therefore, from the EXECUTION perspective, quantities in that range are GREEN ZONE positions for them. The top portion of the PLANNER's RED ZONE becomes the YELLOW ZONE for execution, and the lower portion of the PLANNER's RED ZONE is RED for both PLANNING and EXECUTION. (See first figure above.)
Measuring the Performance of the Protection of FLOW
This simple arrangement does not seek to bog down PLANNING and EXECUTION personnel in the review of hundreds or thousands of numbers on a page or screens. Instead, this gives both team clear indication of the PERFORMANCE of the BUFFER that protects FLOW, Throughput and profits.
It also allows the PLANNING and EXECUTION teams to easily set priorities for actions—again, without looking at rows and columns of numbers.
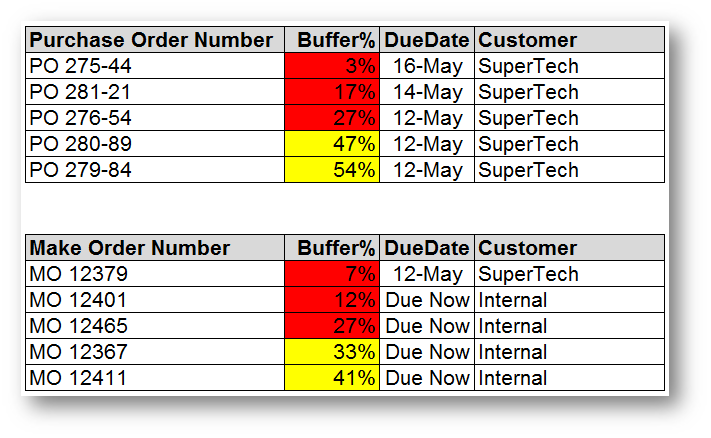
Because both teams get a COLOR and a VALUE, each team can readily and effectively prioritize actions based on the following two very simple rules:
- RED before YELLOW, and YELLOW before GREEN
- ACT on BUFFER STATUS PERCENT in ASCENDING ORDER (e.g., 3% before 17% before 27% in the example above)
Simple. No?
Simplify Your Life and Work
So, simplify your life and work. Stop spending hour after hour pouring over rows and columns of numbers until you're dizzy.
Incorporate the COLOR and a NUMBER system into your ERP solution and know immediately where your precious TIME and ATTENTION should be spent.
Download Learn more about the 8 Sins of ERP Project Failure:
- Common factors that can interfere or derail your ERP project.
- How to define implementation failure so you know what to look for.
- How a successful ERP implementation looks so you know what to measure.
- Guidance for choosing the right ERP system for your needs.
Grab Your Copy
Just leave your email address below and we'll send you a copy of 8 Sins of ERP Project Failure.[si-contact-form form='8']
NOTES:
[1] For more information on how qualified demand spikes and the spike horizon are determined, contact us.
[2] For more information on how planned adjustment factors are determined and employed, contact us.
[3] Want to know more about how MOQ gets involved? Contact us and we will fill you in on the details.