

I think just about every company I have ever worked with on supply chain matters had the same complaint: "We've always got too much of the wrong stuff and too little of the right stuff."
This condition is what Chad Smith and Debra Smith refer to as a "bi-modal inventory distribution" in their outstanding book Demand Driven Performance Using Smart Metrics. Smith and Smith graph that distribution something like you will see in the accompanying illustration.
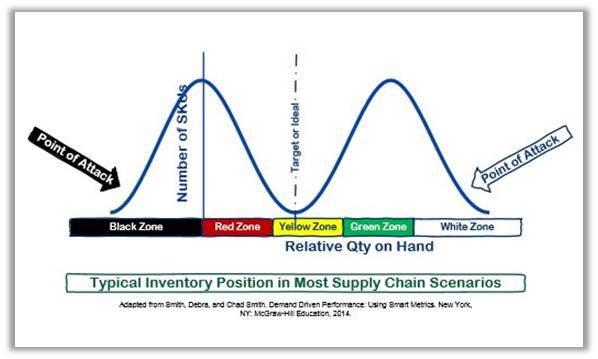
In the diagram, the BLACK ZONE constitutes out-of-stocks. Of course, the out-of-stocks (OOS's) that are most damaging to any supply chain are OOS's accompanied by actual demand, as well. This condition is sometimes referred to as OSWD (out of stock with demand).
The RED ZONE in the diagram signifies those SKUs that are in jeopardy of going OOS in the near future.
On the other end of the spectrum lies the GREEN ZONE and the WHITE ZONE. The GREEN ZONE constitutes the desired maximum stock positions for the various SKUs; and the WHITE ZONE represents an over-stock position (above the desired maximum stock levels for the corresponding SKUs).
The middle range—the YELLOW ZONE—represents where the real value is found in holding inventory. It is the right amount of stock for each SKU based on each SKU's rate of consumption, lead-time, and other factors such as demand and supply variability.
The Typical Approach
There are many reasons that the typical supply chain's inventories end up in this awkward and costly bi-modal distribution. Some of the common reasons are very simple.
Number 1: Many organizations have no really sound methodology for determining what the YELLOW ZONE quantities should be for their SKUs across locations where it stocked.
Number 2: Stocking levels are not dynamically managed in any effective way. (I was working with one company not long ago. I asked them, "How do you determine your minimum and maximum stocking levels for the various items in your warehouse?" The response was little short of staggering: "I don't really know. Those values were set by someone who no longer works here. He figured them all out several years ago, and we have never changed them."
Number 3: Management is constantly putting out fires over OOS conditions, on the one hand, and complaining about having too much inventory, on the other hand. But they have no deliberate plan or method for actually attacking "the tails" of these curves.
Starting Working Your Tails Off
The goal of every inventory and supply chain manager should be to attack "the tails" of these curves—beginning with the worst and most frequent violators. There are certainly tools available that are relatively low cost and can help drive improvement. The goal should be to reshape the distribution of inventory over time to look like what we see in this second distribution curve.
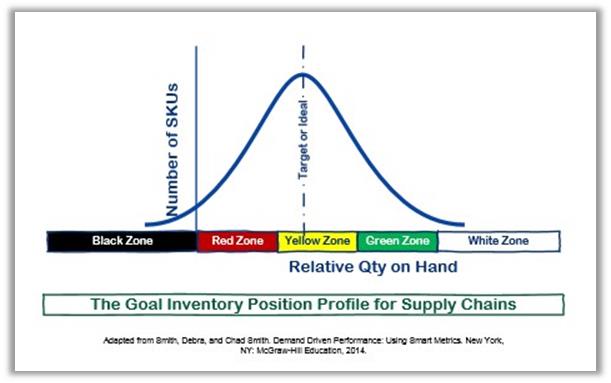
It cannot be overstated that all of the value in holding inventory is found in holding supply chain inventories that maximize flow and minimize waste.
For SKU-Locations (SKU-Ls) repeated found in the BLACK ZONE, supply chain operations must identify the causes of these shortages as rapidly as possible. Then, without delay, operational managers and supply chain executives need to involve themselves deeply in actions that will drive improvement in the availability of these SKU-Ls.
Failure to take effective action means the supply chain will remain unstable and unreliable. Market lead-times and customer satisfaction will suffer.
It is clear that parts frequently found in the RED ZONE or BLACK ZONE are a major cause of supply chain variability, and these SKUs tend to destabilize the entire related supply chain. This leads to a loss of agility and dramatic increases in waste caused by expediting, excess freight costs, and much more.
Too Much Green Also Needs Attention
SKUs that spend too much time in the GREEN or WHITE ZONES need the attention of operations, as well. These SKUs ought be the subject of earnest reviews by sales and marketing to see if there are market trends creating these overages. Production and purchasing managers should also take a close look how SKUs that are frequently found in a too much green condition are purchased or batched for production. Many times policies regarding minimum order quantities or batch-sizing can be changed leading to significant improvements in flow (and resulting profits) with little or no negative impact.
Remember that too much green SKUs are also a major source of supply chain waste. These SKUs stymie flow, reduce agility, consume cash, gobble-up materials that might have been more effectively used in other products that are needed today, occupy space, and may have been produced (consuming capacity) when other products were actually what should have been produced to meet market demand.
Operations should come to a clear understanding in cross-functional teams as to what leads to repetitive occurrences of too much green. Only then can they begin to attack the waste occurring at this "tail" of the curve.
Stop Just Putting Out Fires
If there is to be long-term improvement, it is insufficient to simply put out the fires that erupt at "the tails" of these curves. Effective supply chain managers and cross-functional teams will work these tails off, and reshape their inventory position profiles over time.