

I have been blogging about performance monitor as I am finding that this tool is invaluable for troubleshooting performance on Sage X3, Sage 100 and Sage 500 systems. As a system architect and performance tuner on these systems, I use Perfmon to baseline, troubleshoot performance events and system changes and to capacity plan.
In my first post, Perfmon Overview I give a brief overview of Perfmon and its uses. In my second post I wrote about configuring the interface. In this blog post, I’ll cover adding counters and general understanding of what you are selecting.
The first way to add counters is using the Add Counter Button
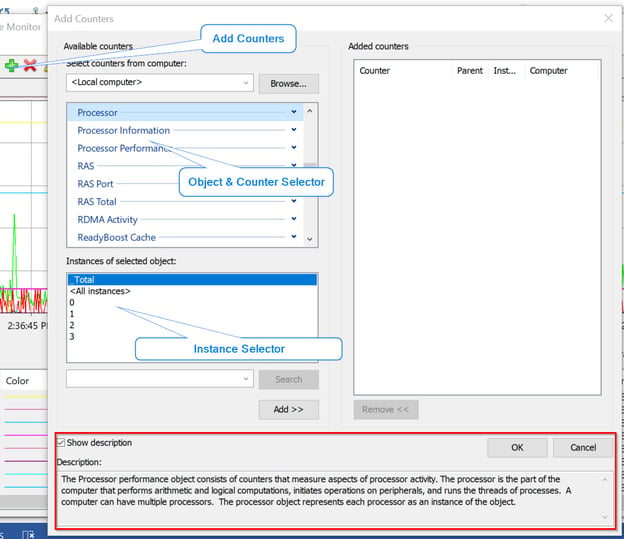
Figure 1 - Add Counters
Clicking the Add Counter button will open the Add Counter dialog. Not that this dialog doesn’t display any of the counters that are already selected. You are able to add counters from the local computer or from remote computers. When monitoring counters on remote computers the data is viewed and possibly stored on the local computer, and will increase network utilization.
The objects and counter select area allows you to select that counters to be added to the monitor.
An Object is the component of the system that is presenting the counter. Objects include the Processor, Memory, Network Interface Cards, Physical Disks and Logical Disks. Some applications, like SQL Server will register additional objects in the performance monitor database.
A Counter is the specific metric that is being measured. If you check the Show Description checkbox at the bottom of the dialog then the system description of the counter will be displayed. The description will many times include the units for the metric.
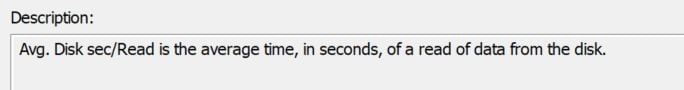
Figure 2- Counter Description
Counter Types – There are two counter types that I am aware of, point-in-time and average counters. The point-in-time counters record the value of the metric when the sample is taken. They do not have a “avg” or other aggregate in their name. Processor Queue Length is an example of a point-in-time counter. Average counters have the abbreviation “Avg” in their name. These counters calculate the average value since the last interval the counter was sampled. All the counters in a monitor have the same sample interval.
Interval Configuration – The default sample interval is 15 seconds. If a point-in-time counter spikes and drops within the interval, the monitor may not record a change in the counter. An average counter on the other hand will be affected by the spike.
The Instance is a more granular detail of the selected counter. Instances can include each processor number, each named process, a drive letter, a NUMA node. There are two special instances, the _Total and the <All Instances>. The total will aggregate all the instances of the counter. The aggregate function depends on the counter type. The <All Instances> will create a separate metric for each instance that exists for the counter. This counter is sensitive to changes in operations. For example, when a new process is started, if you are monitoring the \Process\% Processor Time\<ALL Instances>, the monitor will start collecting data for the newly spun up process.
Important Note: sometimes when selecting a counter in an object, the instances will not appear in the selection list. Selecting another counter in the object and reselecting the original counter will display the available instances. This has been a known issue since 2012 and probably much earlier. I do not expect this issue to be resolved.
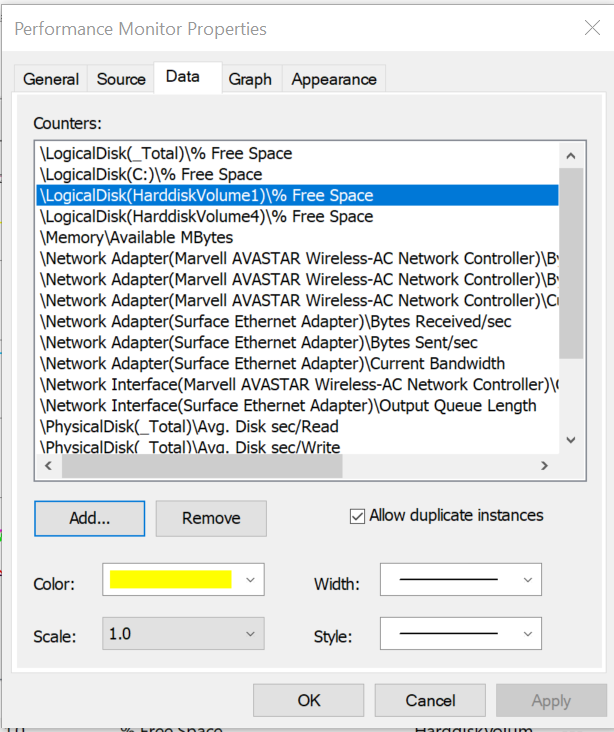
Figure 3 - Adding and Removing Counters
In the properties dialog, the Data tab will allow you to add and remove counters. The Add button will open the same Add Counter dialog as described before. The remove will remove the selected counters from the dialog. The allow duplicate instances will allow the monitor to display multiple lines or values for the same counter instance.
Watch SQL Performance Tuning and Training