


This post is the first in a series of posts I am writing that describes using Performance monitor and Power BI for system performance tuning.
Performance Monitor (Perfmon) is a tool built into the Windows operating system that allows users to view measurements that are exposed by the operating system as well as services and applications. For instance, when you install a SQL Server instance it installs additional categories of counters into the performance monitor database.
There are many third party monitoring tools that are used to collect and store this data. Typically those tools will set the collection interval and will abstract or aggregate this data. These tools will automate the collection and centralize the storage and data viewing. A challenge is that there is a cost associated with the tools and getting companies to approve the cost is a challenge especially when you are in a firefight. Since I work with many customers, I’ll use Perfmon because it is a tool that is always available to me.
To launch Perfmon, type Perfmon into the windows search and the best match will be Performance Monitor.
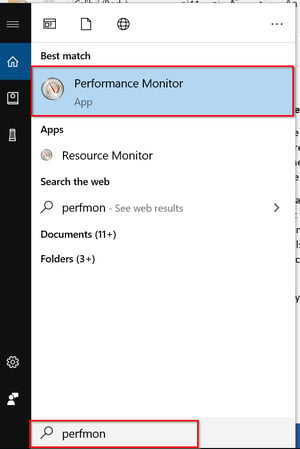 Figure 1 - Perfmon Launch
When you launch Perfmon it will display as follows:
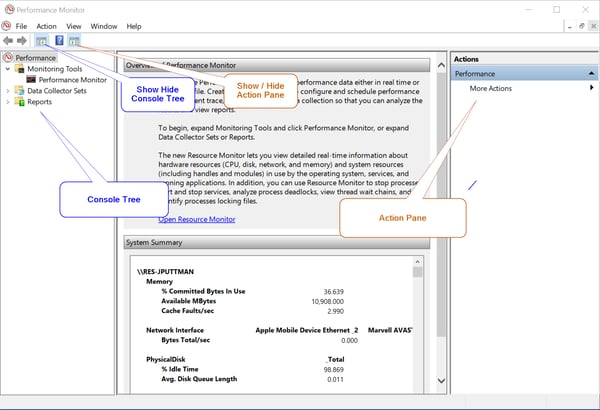 Figure 2 - Performance View
This is the system Summary page and it corresponds to clicking the root node, Performance, in the console tree. You can hide or show the console tree and the action pane using the corresponding tool bar buttons or using the View > Customize menu item. I typically keep the action pane hidden and will toggle the console tree as needed.
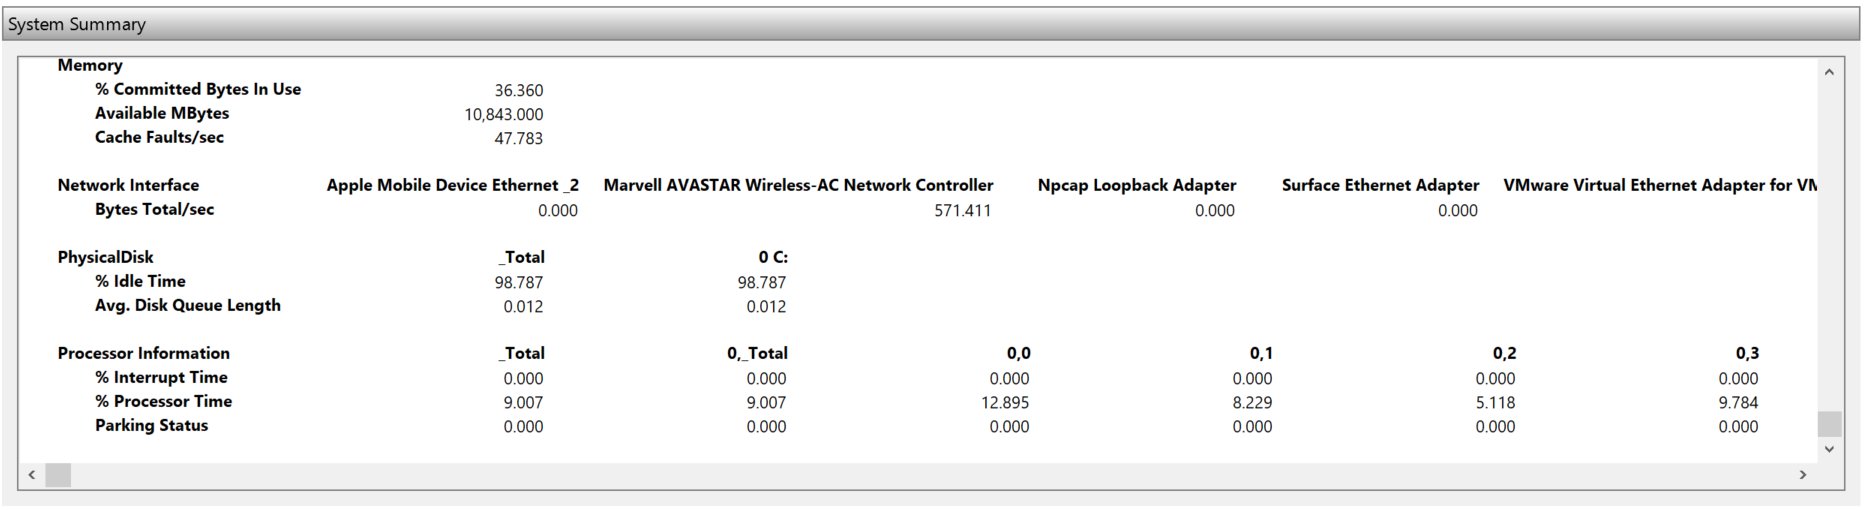 Figure 3 - System Summary
The system summary will show you the current value of counters that the Microsoft team thought were the most basic and important counters to look at. These are shown in the report view. Note that this is broken into the 4 major resource areas for a machine: Memory, Network, Disk and Processor.
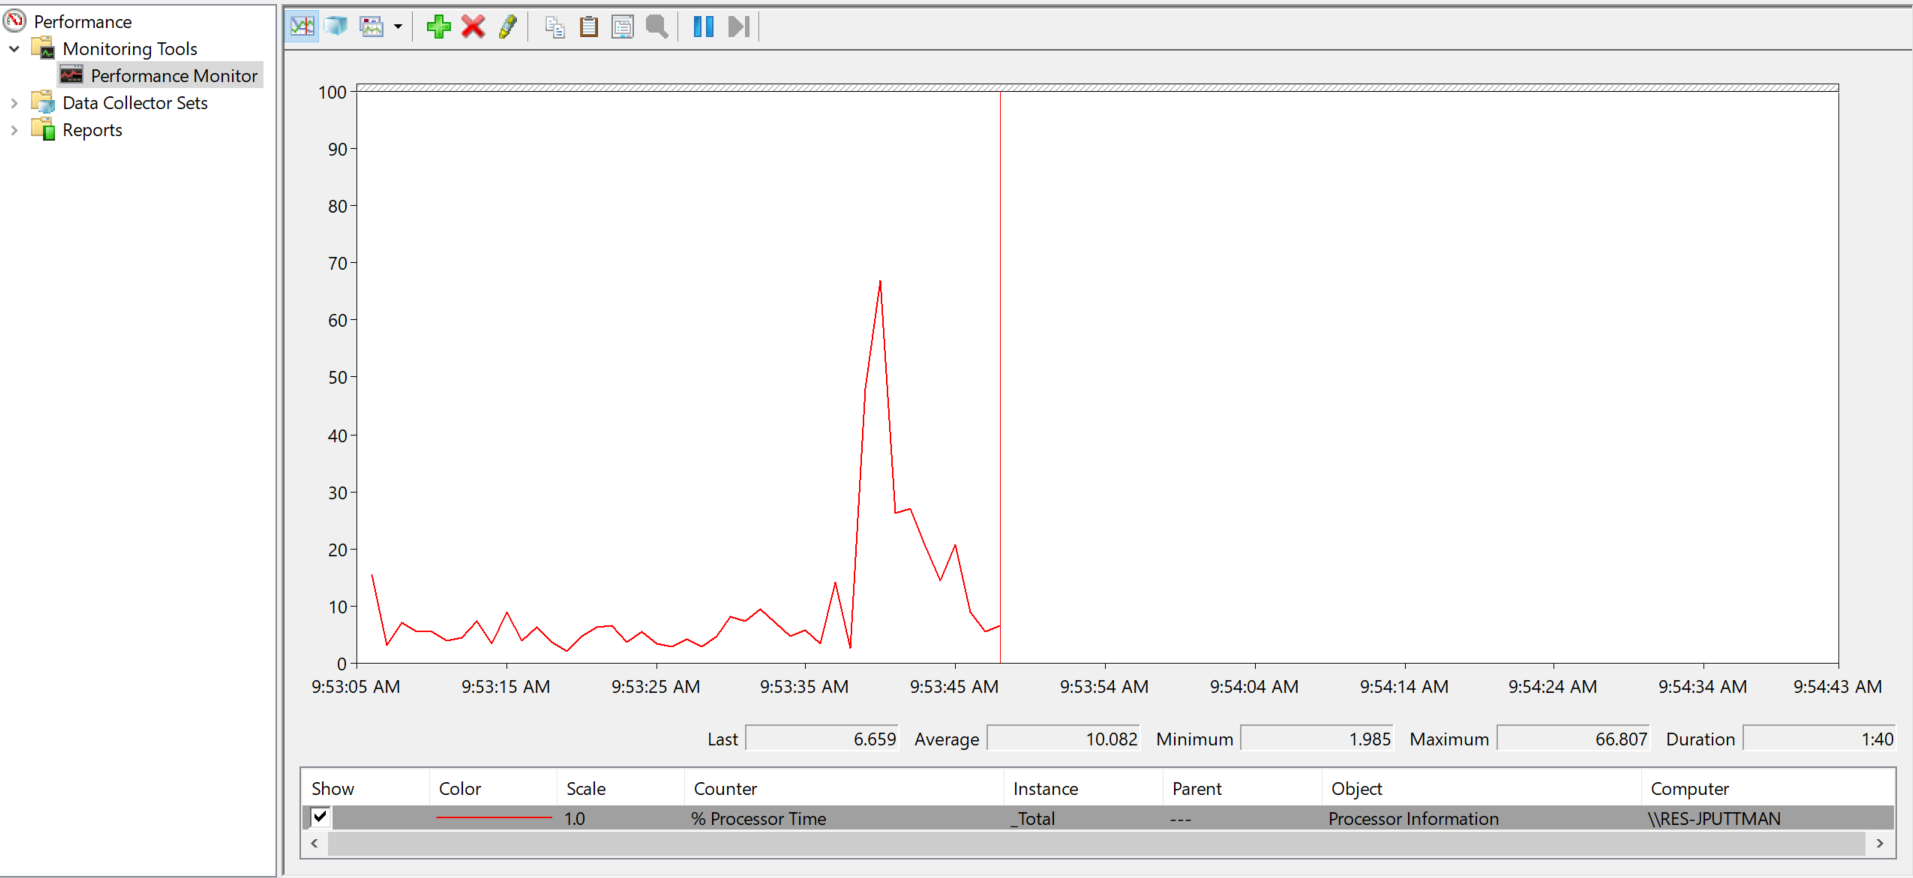
Figure 4 - Performance Monitor Node
Under Monitoring tools in the console tree, the Performance Monitor node will show you a line graph that defaults to show the % Percent Processor Time Counter, for the _Total instance. It will default to show 1 minute 40 second across the X Axis.
There are three display options – Line, Histogram and Report. Each of the display options is updated by for the interval that is set for the monitor.
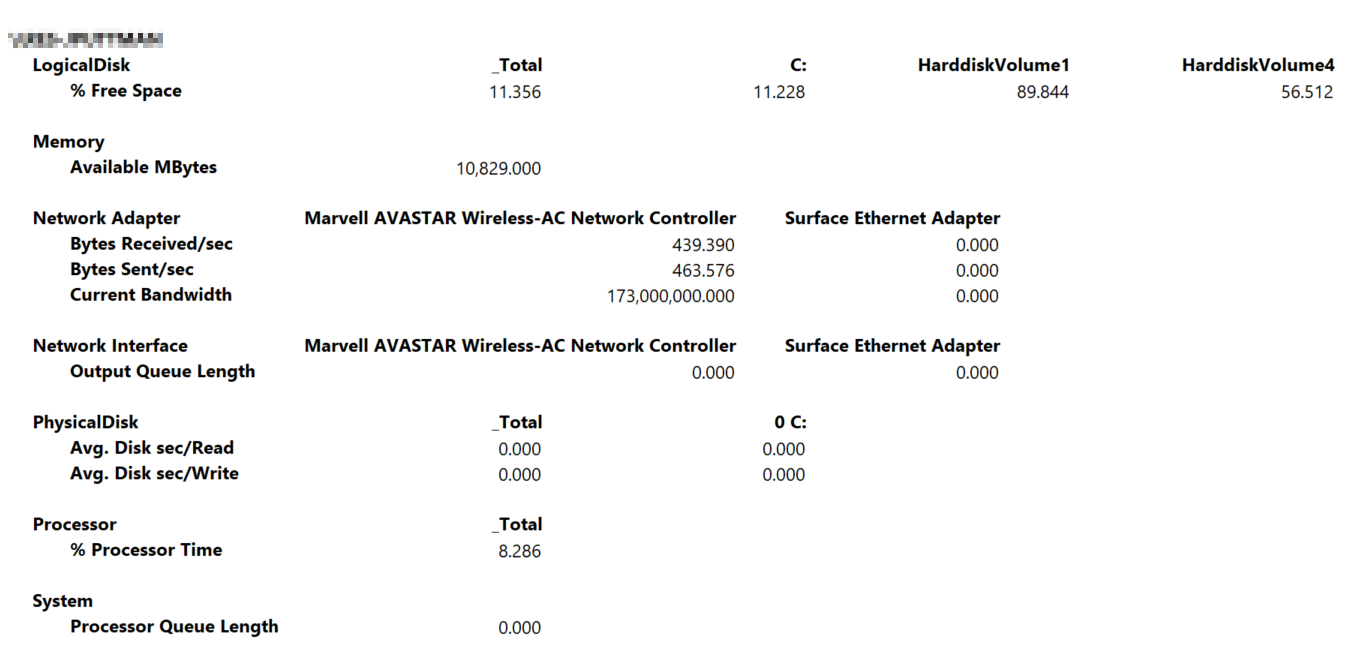
Figure 5 - Report View
The report option is useful as it shows all the numerical values for all the selected counters. This can be really helpful when you have a lot of counters that you are understand at the same time.
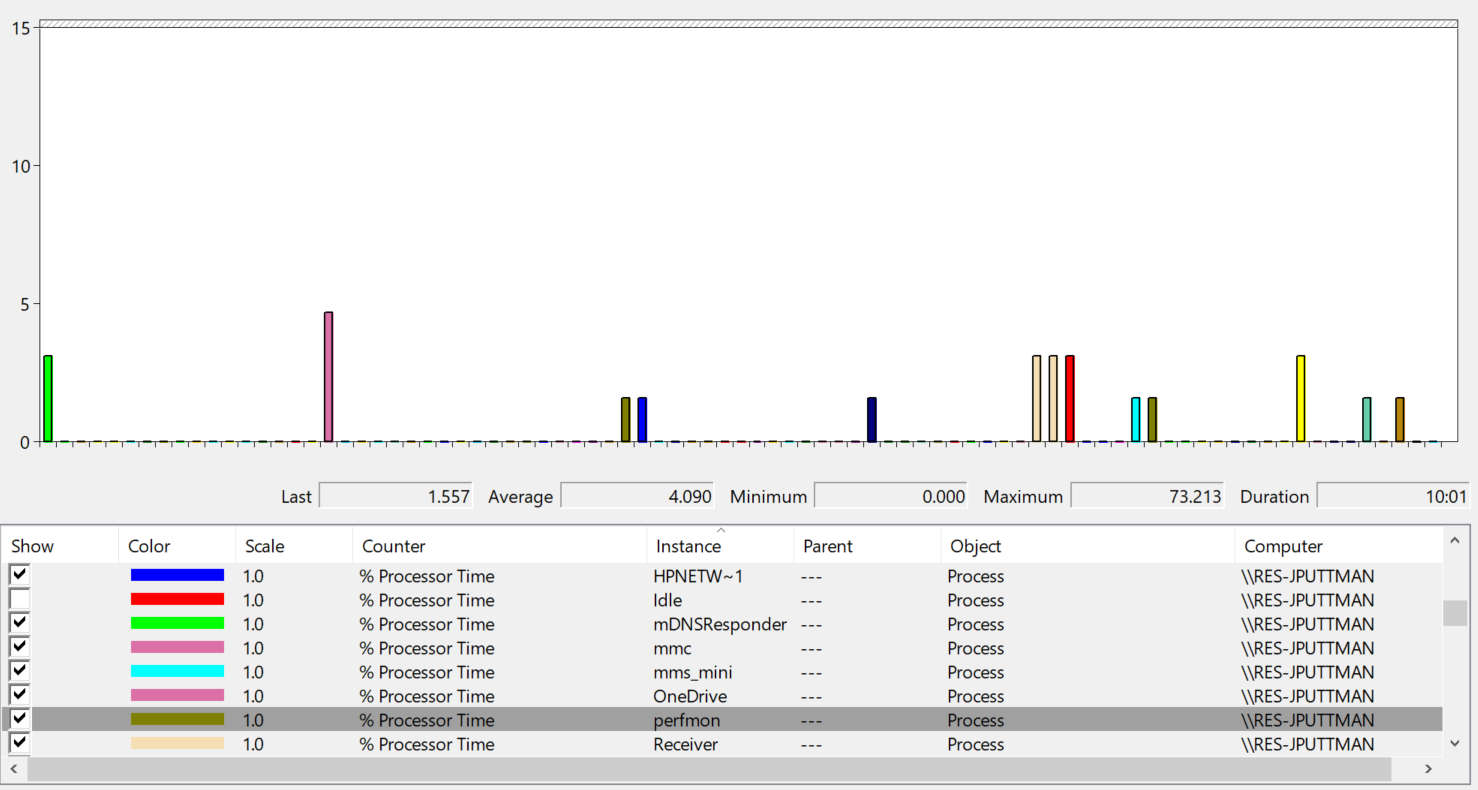
Figure 6 - Histogram View
The histogram view is really useful for comparing the relative values different counters. In figure 6, the process instances of the % Process Time counter are displayed. Each bar in the histogram shows what percent of a processor each process is consuming.
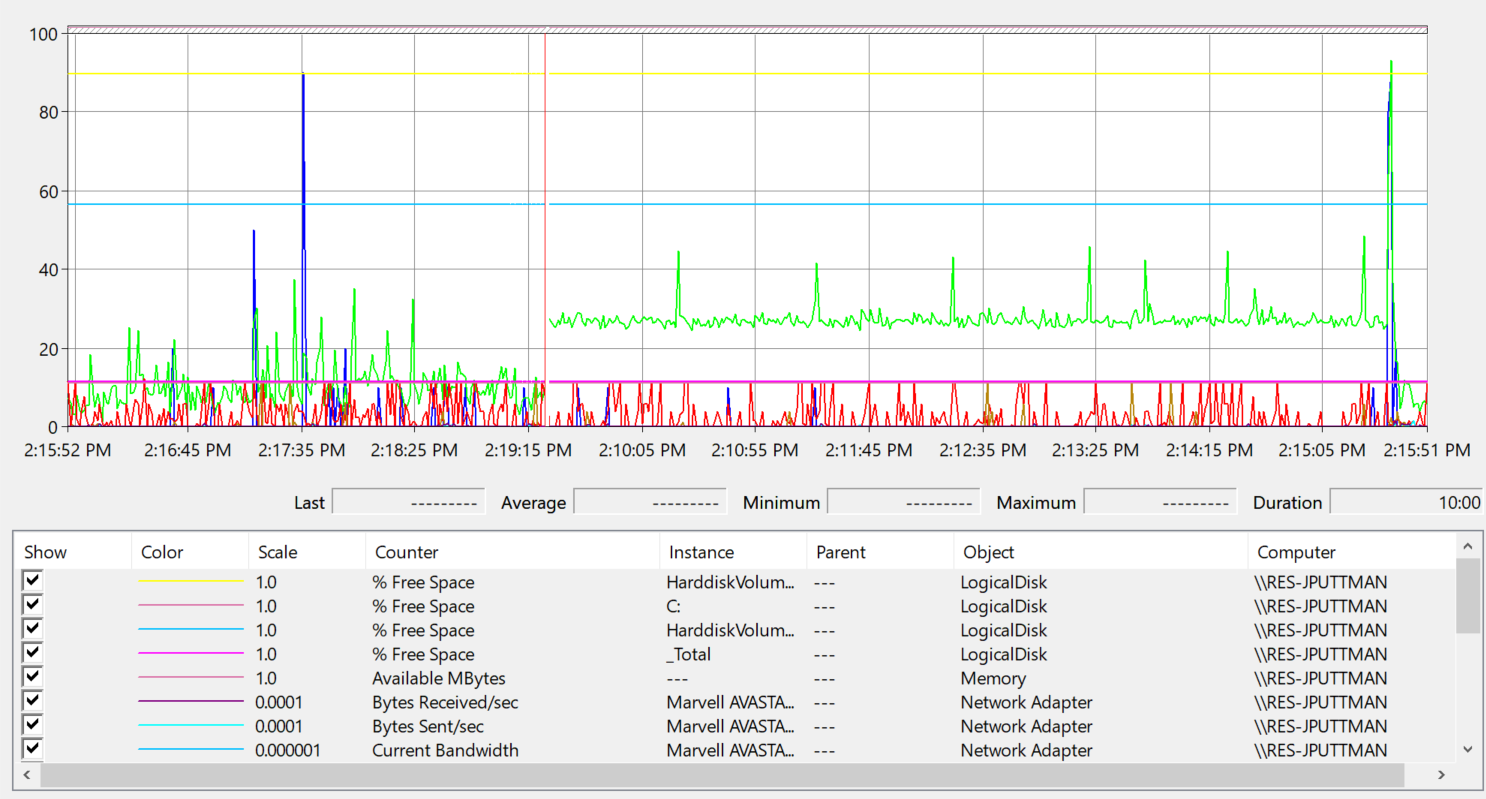
Figure 7- Line View
The line view is the most commonly used view. It is the default view for performance monitor. It shows a line on the chart for each counter and instance. This is useful for seeing trends over time. It is also useful for visually correlating counters or instances that are changing in relation to each other.