

Data can be displayed in a grid format in Sage ERP X3 by adding a Table Block type to a screen. Using the Graph representation in a screen, this data can easily be displayed in a graph by creating graphs in Sage ERP X3 screens. Below are the steps for creating a Graph from table data on an Sage ERP X3 screen.
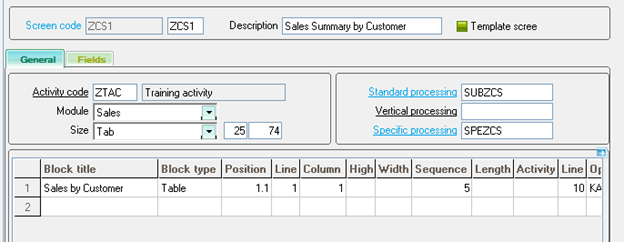
Create the screen
General Tab
-
Create a screen with a Block type of table.
-
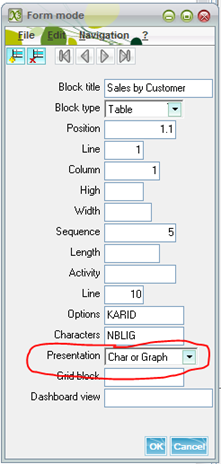
Change the Presentation from "Character" to "Char or Graph".
-
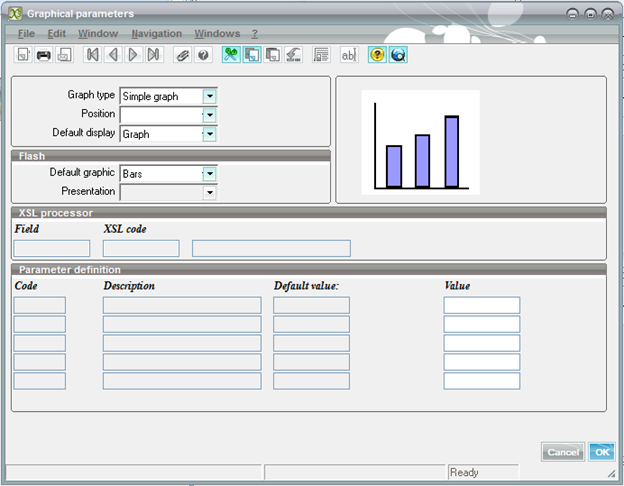
When a Presentation type of "Char or Graph" is selected, a graphical parameters window will appear. Set the values as shown below. (Setting the Presentation type to "Char and Graph" will display both the chart and the graph).
Default display – when this value is set to "Graph", the initial display will be the graph. This can also be set to "Table" to make the table grid the initial display.
Default graphic – select the default graph type to display.
Note: To change the Graphical Parameter values once they are saved, right-click on "Char or Graph" in the grid, and select "Graphical Parameters".
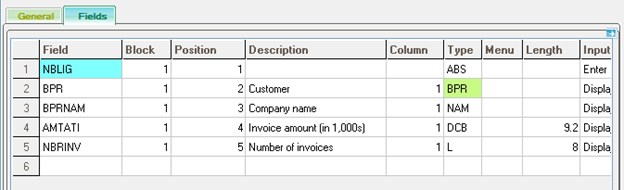
Fields Tab
-
Enter the table fields. This should include at least one numeric measure to graph.
-
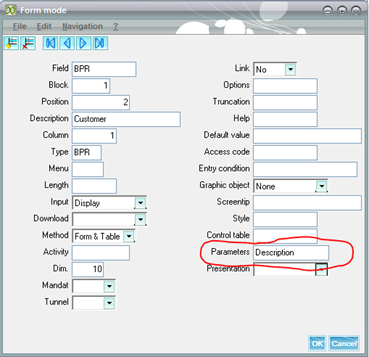
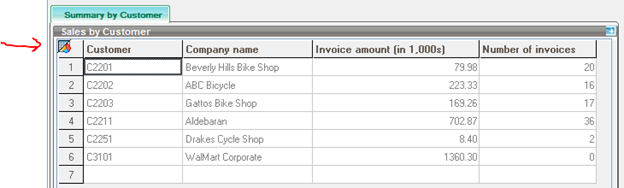
In this example, we are displaying sales by customer, so we want Customer to be displayed as the x-axis on the grid. Right-click on BPR in the field list, and select "Form Mode". Enter "Description" for the Parameters value.
-
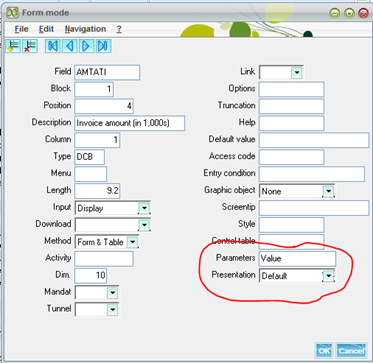
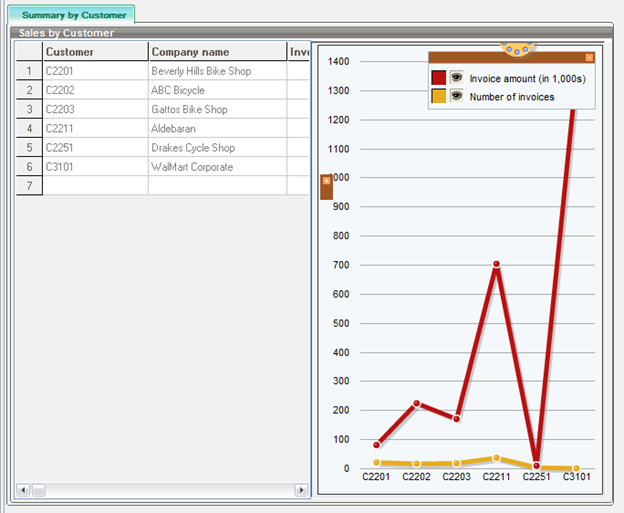
Next, we want the Invoice amount and the Number of invoices to be mapped on the grid's y-axis, by customer. Right-click on AMTAPI in the field list, and select "Form Mode". Enter "Value" for the Parameters value, and "Default" as the presentation. Repeat this for the NBRINV field.
-
Save and Validate the screen.
Populate the table with the data. The code below shows a simple example to load the invoice summary to the grid by Customer.
#######################################################################
## Populate Asset Utlization and History Details
#######################################################################
$ACTION
Case ACTION
When "LIENS" : Gosub LIENS
When Default
Endcase
Return########################################################
## After Load
########################################################
$LIENS# Load Invoice Sales Summary
Gosub LOADSALESReturn
########################################################
## Load Invoice Sales Summary from SINVOICE
########################################################
$LOADSALESLocal Integer NOL : NOL = 0
Local Char CUSTNO : CUSTNO = ""
Local Char CUSTNAM : CUSTNAM = ""
Local Decimal SALES : SALES = 0
Local Integer COUNT : COUNT = 0For [SIH]SIH1 Where CPY = [M:ZCS0]CPY
If [F:SIH]BPR CUSTNO
If CUSTNO ""
[M:ZCS1]BPR(NOL) = CUSTNO
[M:ZCS1]BPRNAM(NOL) = CUSTNAM
[M:ZCS1]AMTATI(NOL) = SALES
[M:ZCS1]NBRINV(NOL) = COUNT
NOL = NOL + 1
Endif
CUSTNO = [F:SIH]BPR
CUSTNAM = [F:SIH]BPRNAM
SALES = 0
COUNT = 0
EndifSALES += [F:SIH]AMTATI / 1000
COUNT += 1Next
If CUSTNO ""
[M:ZCS1]BPR(NOL) = CUSTNO
[M:ZCS1]BPRNAM(NOL) = CUSTNAM
[M:ZCS1]AMTATI(NOL) = SALES
NOL = NOL + 1
Endif[M:ZCS1]NBLIG = NOL
Affzo [M:ZCS1]1-99Return
View the Results
Create a window and function to display the new screens. The results appear below.
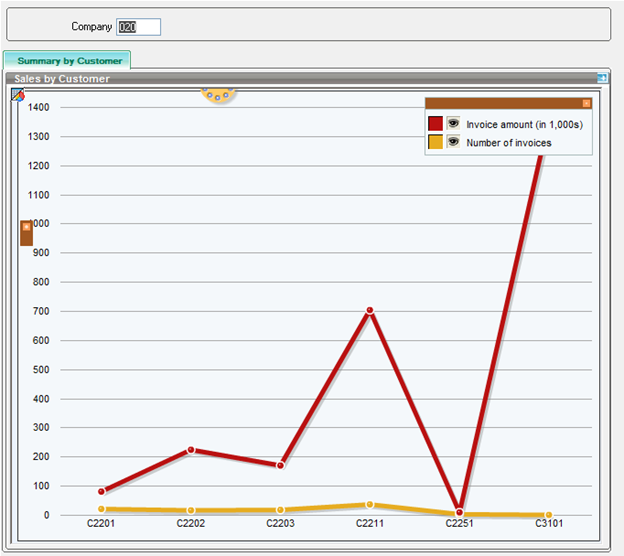
By clicking the "dial" at the top of the page, the grid type can be changed.
Click the small grid icon at the upper left corner, to toggle between graph and table view.
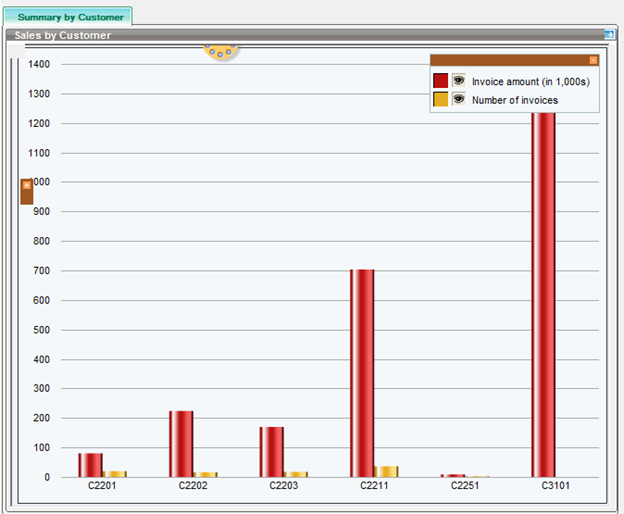
If the presentation type in the screen is changed to "Char and Graph", both the chart and the graph will appear at the same time, as shown below. The position of the graph can be set to appear to the right, left, above or below.
Got Questions?
Contact us if you want to learn more about these features.
[jbutton color="green" size="medium" link="http://www.rklesolutions.com/contact-us/"]Contact RKL eSolutions >>>[/jbutton]