


When working with Sage 500 or other ERP systems, you will sometimes encounter processes that run slow. It may occur right away as you start up after conversion or the slowness may start to show after you have been on the system for years and the data table sizes start to greatly increase. Much of the time you can look at the SQL Server execution plans in the plan cache to identify the root cause of the performance problem. Sometimes this troubleshooting method doesn’t work.
I recently needed to performance tune the stored procedure in Sage 500 underlying Process Replenishment Orders, called spimCreateSuggOrd. When I tried to get the plan out of cache. I initially thought it was being purged due to normal cache maintenance. However, the stored procedure wouldn’t ever appear in the plan cache, even when I checked the cache right after the procedure was run. I ended up doing a code review of the procedure and found that there were a few cursors in the procedure and that one of the loops, in particular, was executing once for each of the records in the main table that was being processed, which can have more than 10,000 rows. Normally, I would try to refactor these cursors to a set based approach. However, this stored procedure was native application code and had many dependencies within the database, both in tables as well as called stored procedures. This made refactoring the cursors to set based cursors time and cost prohibitive.
I also recognized that the overall performance problem was not just one query that was taking a long time or even a few queries, but it was that a number of queries were being called thousands of times and that was adding up to poor performance. I needed to be able to see which procedures or queries were causing the longest runs.
Summary of approach:
- SQL Profiler Trace - Run a very tight trace to capture TextData and durations
- Save to SQL Table – Save the trace from profiler to a SQL table for further analysis
- Add NVARCHAR TextData50 Column – The TextData column is created as nText and the string operator of LEFT cannot be applied. The value of this column is LEFT(TextData, 50).
- Run Aggregate Query and Analyze – You are grouping by the new column called TextData50 and summing the duration column.
The sum of duration allows you to see the overall impact of any one statement on the overall process and use that to target tuning efforts.
SQL Profiler Trace
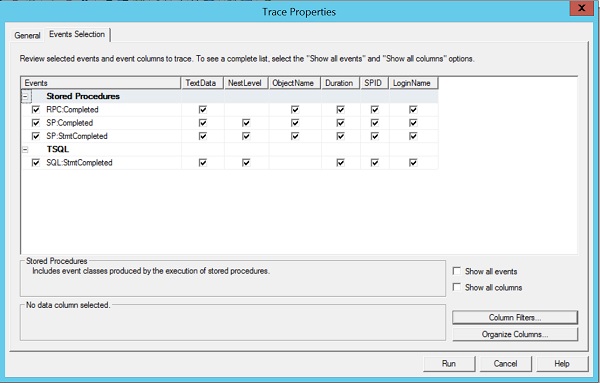
This is a screen shot of the events and columns that I trace. The completed events include a duration. When you look at the results in profiler all the completed events appear in the order that they are completed, so it may be in the reverse order of what you would expect to see. The RPC:Completed event is the last event that will appear in the trace. The RPC (remote procedure call) is what occurs when the application calls SQL server to execute code. If the RPC event calls stored procedures then you will see SP:Completed and SP:StmtCompleted events nested within the RPC event. Each procedure that is called within a procedure will increase the NestLevel, so the higher the number the deeper in the stack the call occurs. The RPC call will be NestLevel = 1. I use the SQL:StmtCompleted to verify I am seeing all events.
From a column perspective, the duration event is key. The duration, when shown in Profiler, will show in milliseconds, which may show zero (0) for many of the events. When you transfer this to a sql table duration will show in microseconds to give you more granularity. The object name will show the name of the stored procedure or trigger that is executing the code. The LoginName is typically used to filter the trace to a specific user. Ensure that the user has all other applications closed and is just executing the one task to be tuned.
Start the trace just prior to the beginning of the task execution. Stop the trace when the task is completed. It will had some overhead to the execution durations.
Save to SQL Table
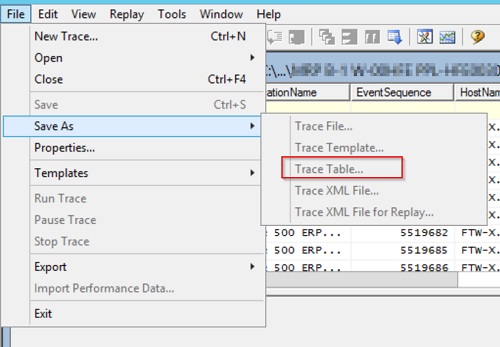
Once to the trace is stopped you can save the trace to a SQL table. This will bring up a dialog to select the database and table name of where to save the trace data. I usually suffix my trace table with “_trc” as suffix but this is not critical, just remember the table name.
If you are running on a production server, you may want save the trace data to a trace file and then copy the trace to a development or test server to review to remove the load from the production SQL Server.
Add an NVARCHAR(50) column to trace tab
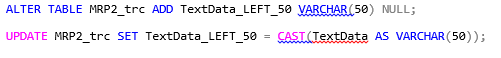
The TextData Column is in the trace table is created as a ntext column. If you try to use a Left string function against this data, the system will bark at you with an error of “Argument data type ntext is invalid for argument 1 of left function. “ To work around this create another column in the table to hold the left 50 characters of text data, and then update the column with the data from the original column.
ALTER TABLE MRP2_trc ADD TextData_LEFT_50 VARCHAR(50) NULL;
UPDATE MRP2_trc SET TextData_LEFT_50 = CAST(TextData AS VARCHAR(50));
Run Aggregate Query and Analyze
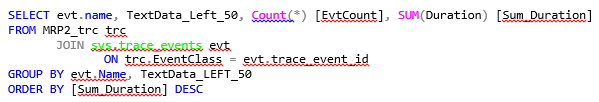
The aggregate query at this point is pretty straight forward. You are grouping by text data and getting the sum of duration, ordering the results by the sum of duration so you know what is most costly.
SELECT evt.name, TextData_Left_50, Count(*) [EvtCount], SUM(Duration) [Sum_Duration]
FROM MRP2_trc trc
JOIN sys.trace_events evt
ON trc.EventClass = evt.trace_event_id
GROUP BY evt.Name, TextData_LEFT_50
ORDER BY [Sum_Duration] DESC
The results will look something like this:
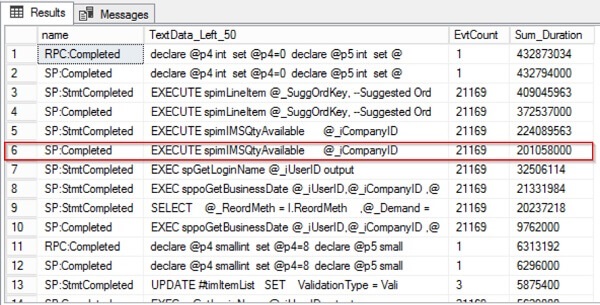
The full run was 432 seconds. The highlighted stored proc was run 21,000 times for a total of 201 seconds for almost half the total run time.
I was able to check the query plan at that point for this stored procedure and found that one section of code, about 4 statements was 30% of the effort (see my post on improving Replenishment Performance). We modified that code and achieved a 5x to 10x performance increase depending on the size of the run.
In the future, when you are troubleshooting SQL Server performance and you run across a cursor that you just can’t refactor, use this method to isolate the problem statements. It will give you a much clearer picture of what is causing your performance issues. With that knowledge, you are more than halfway to your performance solution.

Additional Sage 500 Blogs
Improve Sage 500 Performance of Process Replenishment Orders
Using Crystal Reports to Generate Reports from a Command Line
Exporting, Importing, and Managing your Customization with Sage 500 Customizer