


Using Extended Events to Performance Tune Sage 500 - Part 7
Analyze the data for queries that aggregate to large impact
In this final post I am looking for queries that don’t show in the query for longest duration by individual run, but still have an impact because they are run over and over again, either in a loop that occurs in SQL Server or it may be in a loop in the Sage 500 client, and called repeatedly. This is looking for the “Row by Agonizing Row” (RBAR) impact.
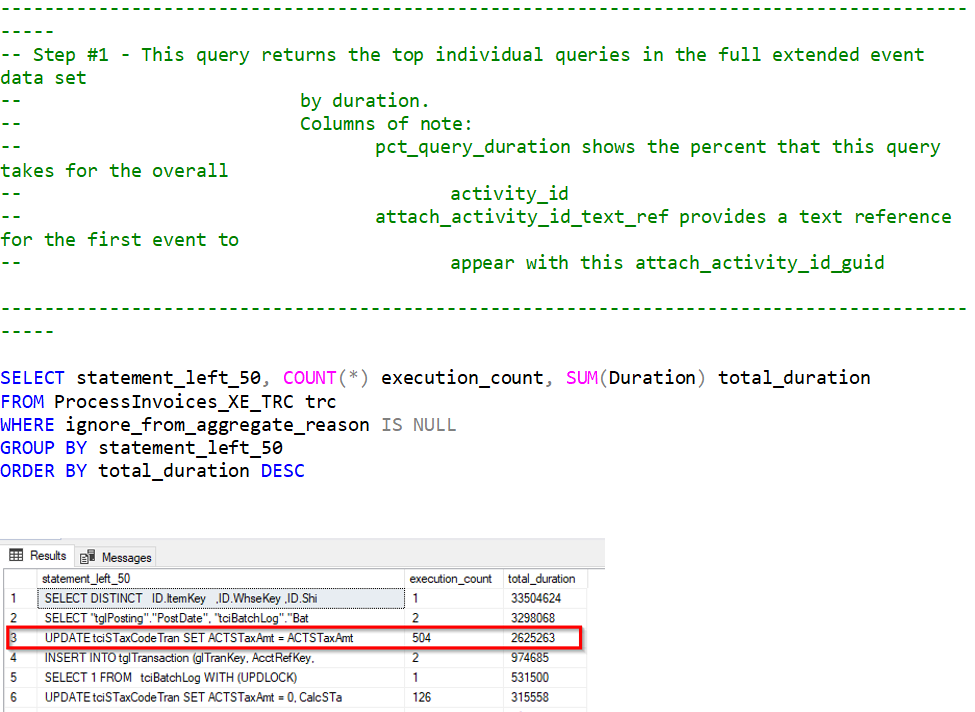
In this case there is one query that catches the eye. This one didn’t show up in the individual queries but it was executed 504 times for a total of 2.6 seconds, or an average of 5ms per run. This frequency is probably not something I would worry too much about in a Sage 500. However, I have used this technique and found an individual query that was run 30,000 times in a process and taking around 500 ms per execution. The full process was taking around 6 hours to complete. Changing this one query dropped the overall execution time to less than 15 minutes.
I hope that you have learned something about using Extended Events to performance tune in Sage 500. If you have questions or need assistance, please feel free to reach out to our team >> Contact RKL eSolutions
Full Troubleshooting Series
Parsing an Extended Event Attach_Activity_ID into Component Parts with the String_Split Function
Using Extended Events to Performance Tune Sage 500 - Overview
Identifying the Sage 500 Task Name as seen in SQL Server
CREATE AN EXTENDED EVENTS SESSION FOR RECORDING ALL THE ACTIVITY UNDER A TASK
Running the XE Session and Brief View of Events
EXTRACT THE XE DATA FROM THE EVENT FILE AND LOAD IT INTO A SQL TABLE