


Using Extended Events to Performance Tune Sage 500 - Part 2
Create an Extended Events Session for recording all the activity under a task
This second installment of blog posts on using extended events to performance tune Sage 500 will be a bit longer. It walks through how to create the XE session for a specific task. In part 1, I determined that the program name for Process Invoices started with Sage 500 ERP/AR Batch Form. I will use this name to filter this XE Session.
This example is using SQL 2012 to create the extended event session. However, this process is very similar in SQL Server 2012 – SQL Server 2019.
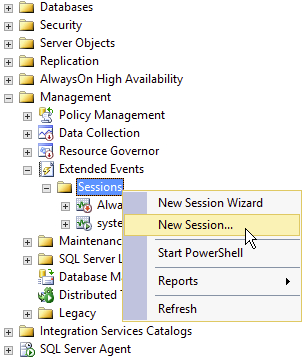
In SSMS Object Explorer open the Management tab, then the Extended Events tab.
Right-click the Sessions tab and select New Session.
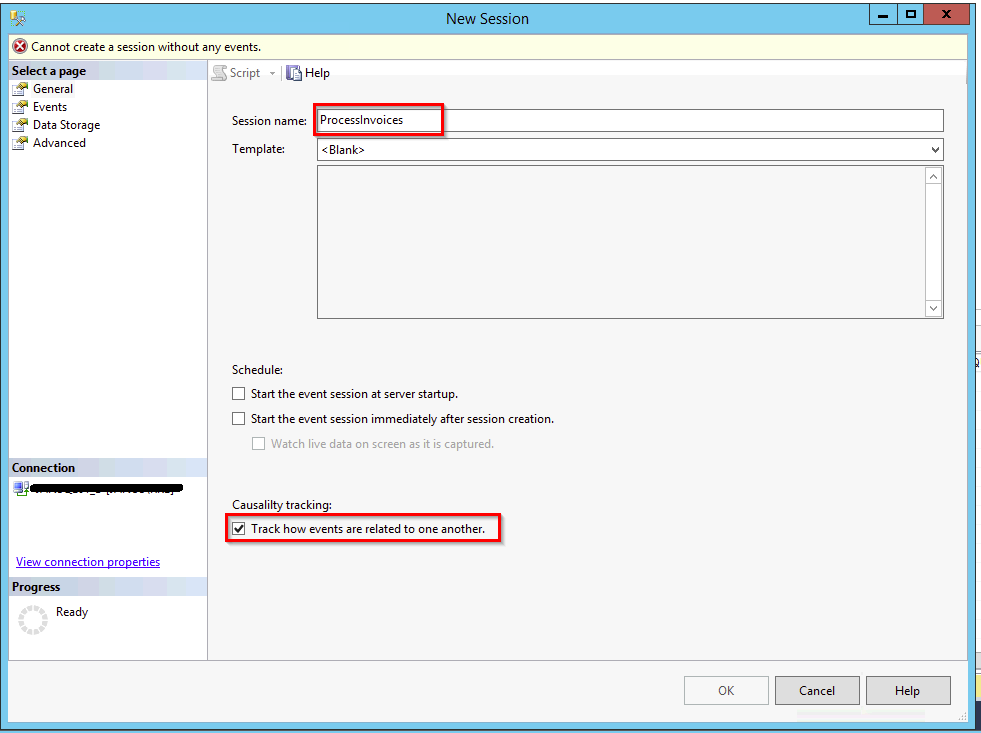
I prefer the New Session dialog over the New Session Wizard as the dialog allows enabling Causality Tracking which adds a GUID and an event counter to each of the events recorded in a session. The GUID is created upon the first RPC call and is the same for all events captured in that code stack, with each event getting an incremented counter number. I’ll explain how to use this in Part 5 - Adding helper columns to the XE table.
In the New Session dialog’s General page
- Enter ProcessInvoices in the Session name field
Click the Events page from the page selector in the upper left of the dialog.

For those of you used to SQL Profiler this may be a bit disconcerting the first few times you do it. The Event Page is the dialog used to select all the events you want to capture, select the data you want to capture, and configure filter predicates.
For performance tuning I want to minimize the number of events that are captured. XE sessions have around a 4% performance hit. This is compared to 50% – 60% for a Profiler trace. But even with only a 4% hit I want to ensure minimal impact, especially when I run this unattended.
- Using the Event Library search box enter “rpc_” and then scroll to the bottom to find the rpc_completed and rpc_starting
- Select these two events and click the right arrow to add them to Selected events.
- Back in the Event Library search box enter “_statement_c” to find and add the sp_statement_completed and sql_statement_completed
- Click the Configure button in the upper right, to configure the columns to select and their filter predicate.
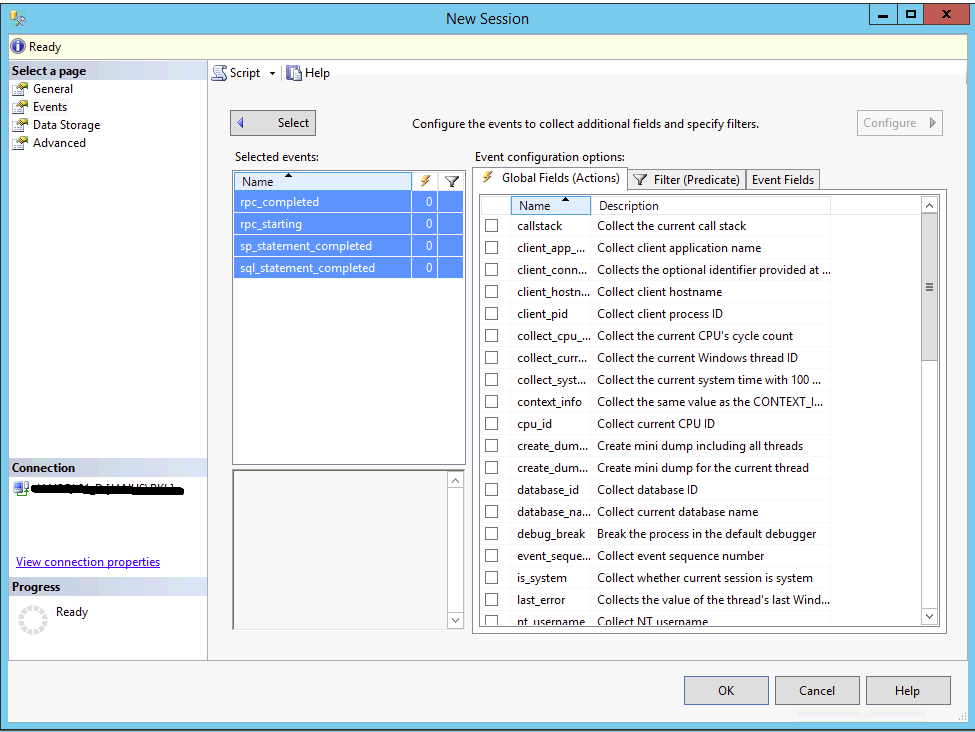
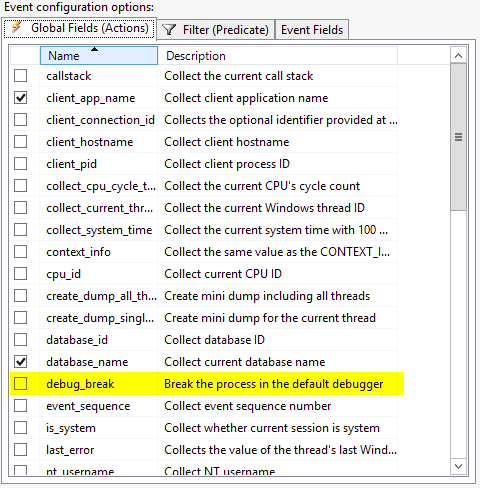
To select all four events use CTRL + CLICK on each event to do a multi-select. In the Event configuration options section you will select the fields that you want to capture in the XE session. The Global Fields (Actions) are fields that are available at the server level and can be collected for all selected events. They are called actions as the server must take an action when an event fires to collect the related data and include it in the event record. I limit the number of global fields that I capture to just those needed for the troubleshooting that I am doing. In this case I select client_app_name and database_name.
IMPORTANT NOTE: Do not select the debug_break Global Field (Action). I accidentally checked this on one XE session that I setup on a production server. When the selected extended event was hit, it caused the sql server to restart. I suspect that there is a useful need for this in a development environment, but don’t accidentally select this.
Less Important Note: The sql_text Global field captures the input buffer at the time the event is fired. The event fields contain the statement field which captures the exact statement that is being executed. The sql_text will capture the entire batch text.
Click the Filter (Predicate) tab.
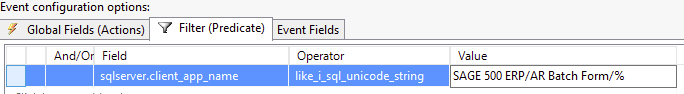
- Select Click here to add a clause. Since you have the four events selected, the filter will be applied to all four events.
- In the Field drop-down select client_app_name.
- In the Operator drop-down select like_i_sql_unicode_string. This is equivalent to the LIKE operator in T-SQL.
- In the Value box enter SAGE 500 ERP/AR Batch Form/% to filter the session to collect only events that are coming in from the Process Invoices task within Sage 500 using name that is presented to SQL server
- You don’t have to put quotes around the value as SQL Server does this for you.
- The % wildcard allows us to capture events for each user running the Process Invoices form as each session appends a unique value to the application name.
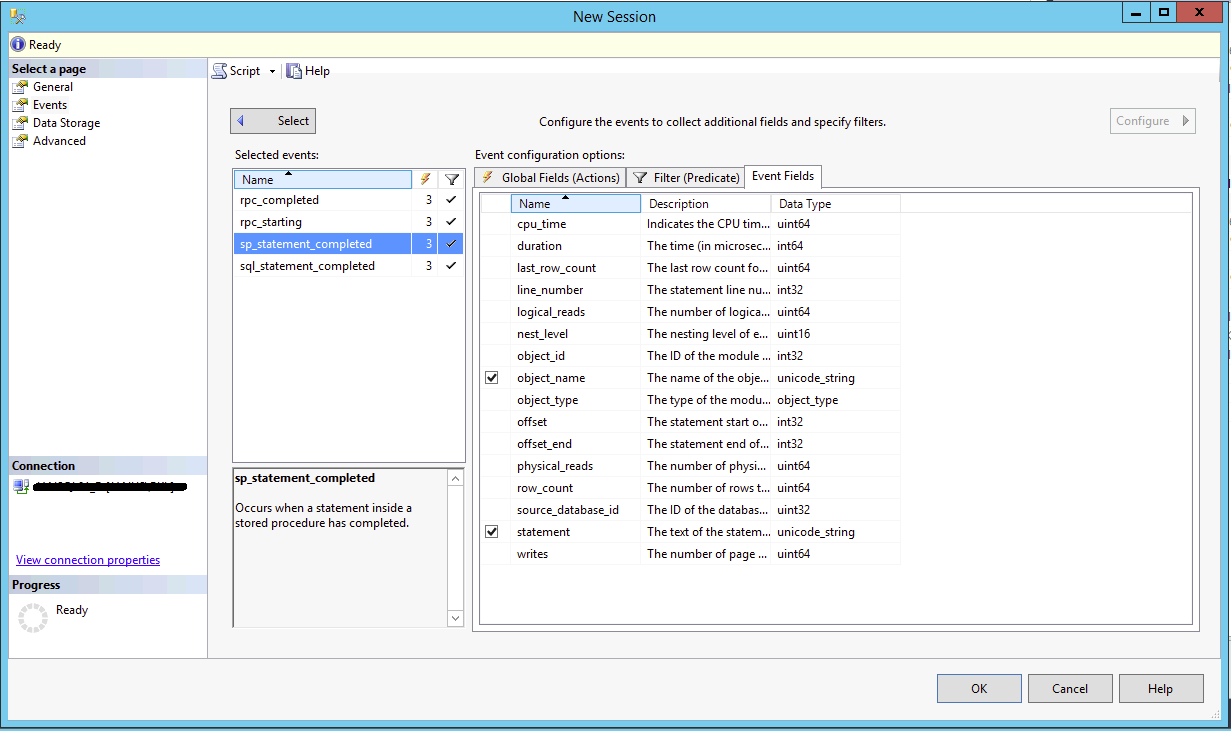
Last you will review the fields that are captured for each event by selecting the Event Fields tab. These have to be reviewed for each individual event as the event payloads are different. Note that any event field that does not have a checkbox selector will automatically be captured. The fields with the checkbox are optional. Ensure that you include the statement and the object_name fields where available.
- In the Name field select the:
- rpc_completed event to confirm the statement event field is selected
- rpc_starting event to confirm the statement event field is selected
- sp_statement_completed event to
- select the object_name event field
- confirm the statement event field is selected
- sql_statement_completed event to confirm the statement event field is selected
Once you have the Events page configured, select the Data Storage page.
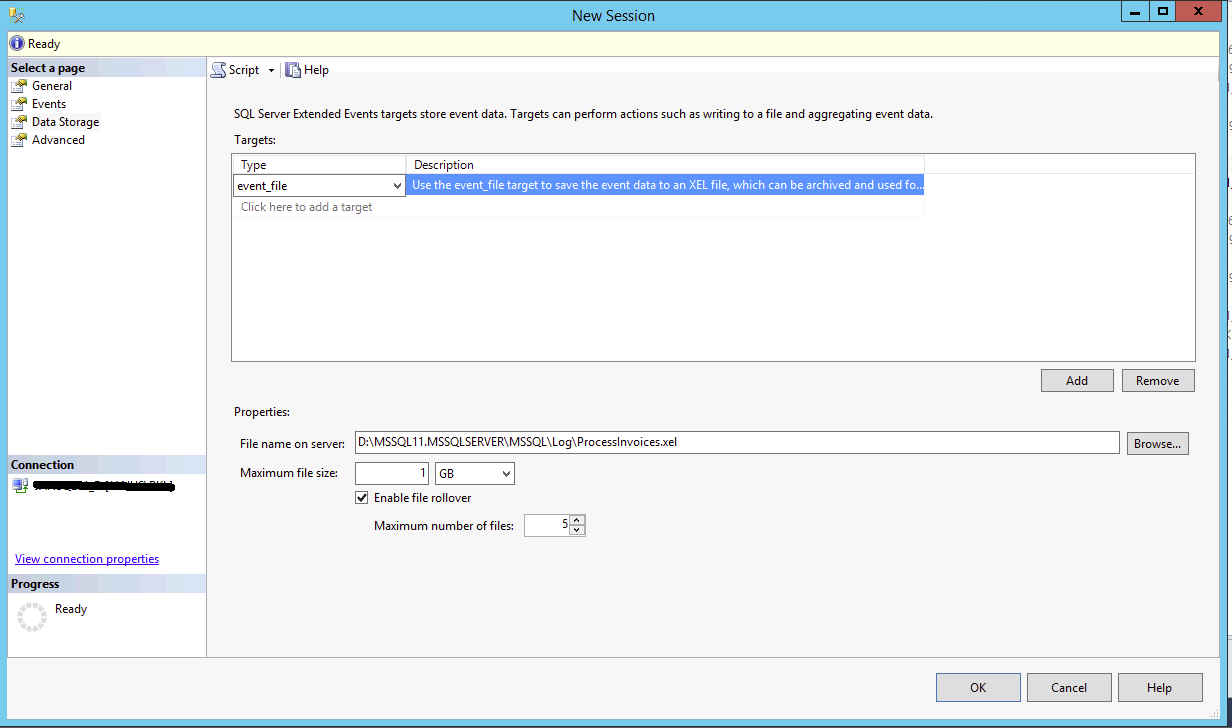
- Select Click here to add a target
- In the Type drop-down select the event_file target type.
- In the File name on server field type or browse to your desired location and enter the desired file name of the file.
- Use XE Session name as the file name for simplicity’s sake
- Keep the default values for:
- Maximum file size (1 GB)
- Maximum number of files (5). SQL server will add a suffix to the event file names to ensure that each file is unique.
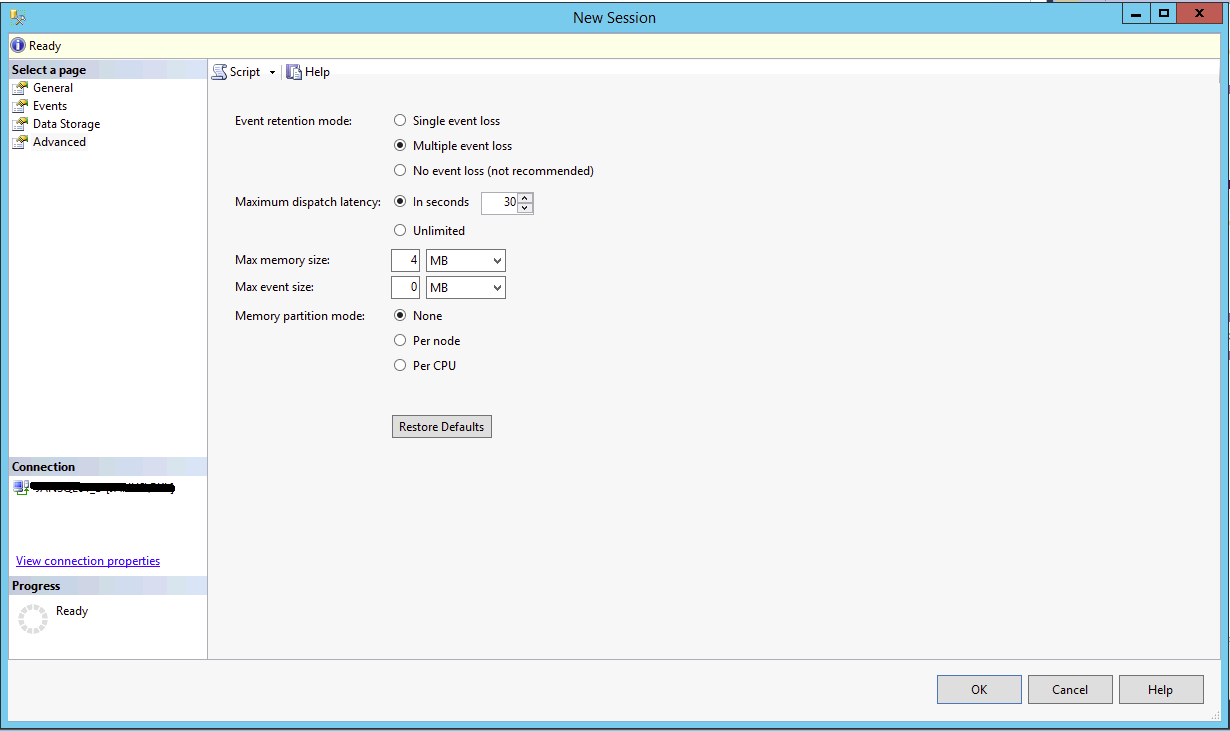
Finally, set up the Advanced page. The event_file target is an asynchronous target. SQL Server holds the data in memory for a period of time and will flush it to the file periodically. On this tab I change the Event retention mode to Multiple event loss. This allows SQL to bypass recording the event if there is significant performance degradation. Since I am not debugging exact statement execution and am looking for long running queries, having some data loss in my XE session has been a good trade off on production servers. I leave the remaining fields set to their default values.
Once you have all 4 pages configured click OK and the XE Session will appear in your object browser.
More in this Troubleshooting series
Parsing an Extended Event Attach_Activity_ID into Component Parts with the String_Split Function
Using Extended Events to Performance Tune Sage 500 - Overview
IDENTIFYING THE SAGE 500 TASK NAME AS SEEN IN SQL SERVER
CREATE AN EXTENDED EVENTS SESSION FOR RECORDING ALL THE ACTIVITY UNDER A TASK
Running the XE Session and Brief View of Events
EXTRACT THE XE DATA FROM THE EVENT FILE AND LOAD IT INTO A SQL TABLE
ADD HELPER COLUMNS TO THE XE TABLE
ANALYZE THE DATA FOR LONG-RUNNING SINGLE QUERIES
ANALYZE THE DATA FOR QUERIES THAT AGGREGATE TO LARGE IMPACT
GOT QUESTIONS ABOUT Sage 500 ERP?
Contact us if you have more questions about your Sage 500 solution >> Contact RKL eSolutions