


Using Extended Events to Performance Tune Sage 500 - Part 6
Analyze the data for long-running single queries
Wow, you are getting close to the finish…and so am I! Again this post assumes that you have followed the previous 5 parts in this blog series and have two tables: an extended events trace table with additional helper columns and a table that has aggregates for the activity_ids.
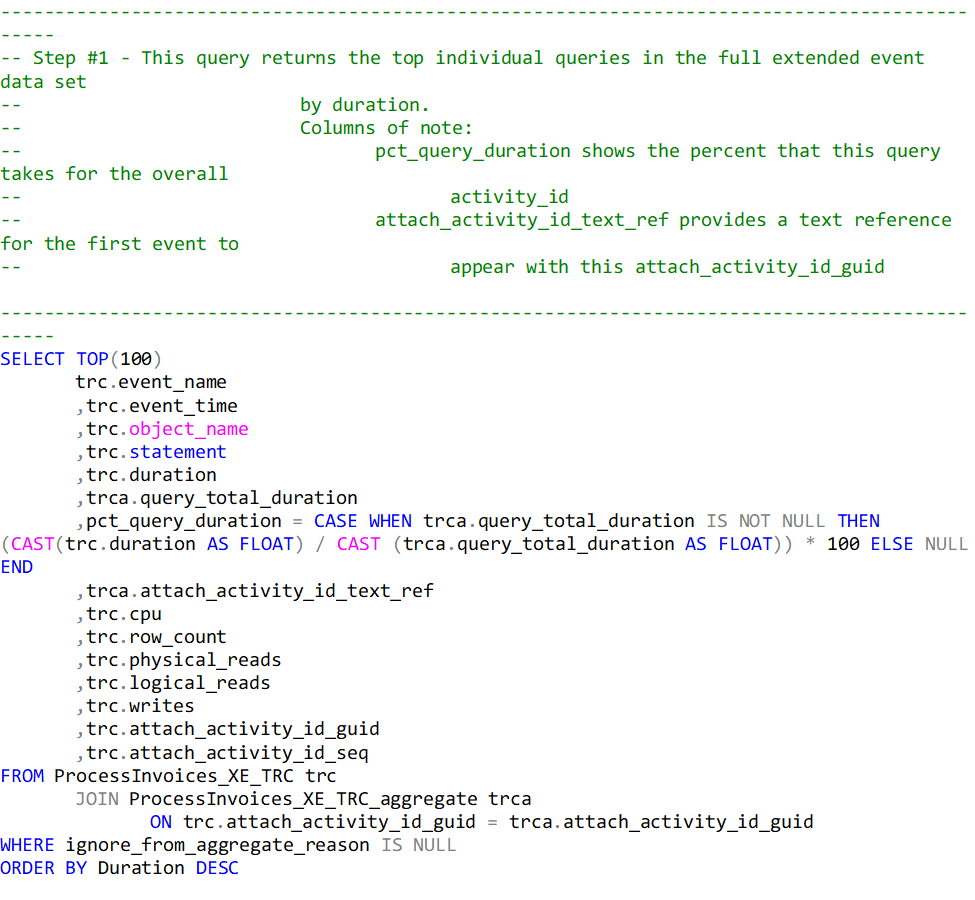
The following query shows the top 100 individual queries in the entire data set. The pct_query_duration column shows the individual query duration as a percent of the total duration of the activity_id. The attach_activity_id_text_ref column gives a reference as to what is happening in this overall activity. It comes from the event with a seq = 1 for the attach_activity_guid.
This query identifies the individual queries that are candidates for tuning.
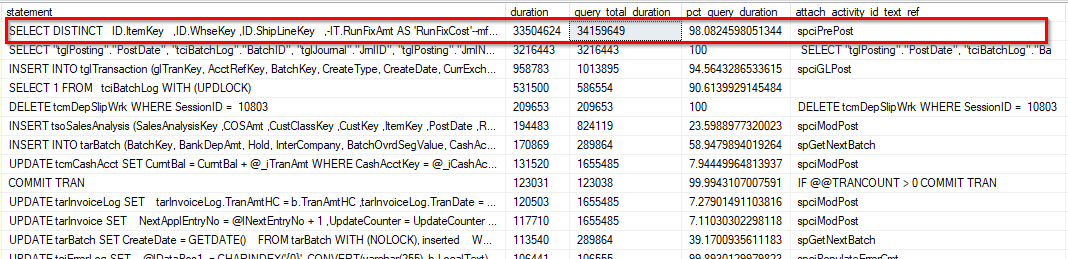
In my example data set the first query is took 34 seconds to run and is 10 times longer than the next longest query of 3.2 seconds. It is also is 98% of the total activity that starts with spciPrePost. This is definitely a query that is in need of tuning.
More in this Troubleshooting series
Parsing an Extended Event Attach_Activity_ID into Component Parts with the String_Split Function
Using Extended Events to Performance Tune Sage 500 - Overview
IDENTIFYING THE SAGE 500 TASK NAME AS SEEN IN SQL SERVER
CREATE AN EXTENDED EVENTS SESSION FOR RECORDING ALL THE ACTIVITY UNDER A TASK
Running the XE Session and Brief View of Events
EXTRACT THE XE DATA FROM THE EVENT FILE AND LOAD IT INTO A SQL TABLE
ADD HELPER COLUMNS TO THE XE TABLE
ANALYZE THE DATA FOR LONG-RUNNING SINGLE QUERIES
ANALYZE THE DATA FOR QUERIES THAT AGGREGATE TO LARGE IMPACT
GOT QUESTIONS ABOUT Sage 500 ERP?
Contact us if you have more questions about your Sage 500 solution >> Contact RKL eSolutions